Save 23% ($351) & Get a Free 1-1 Call with our Team ⏰ : 0d 2h 59m 44s
Cryptocurrency Inflows & Outflows: What do they mean?
You've probably heard of "X amount of coins were sent to an exchange" or "X amount of coins were just withdrawn from exchanges". These refer to exchange inflows and outflows, but what do they mean?

TLDR
- Exchange inflows (deposits) communicate upcoming selling pressure
- Exchange outflows (withdrawals) communicate bullish sentiment
- This aspect is not actionable on its own but can act as a good confluence of metrics
The Depiction
Let's start out very briefly by describing how the process works. Exchange addresses are well-know by people, in fact you can go to EtherScan and find different exchanges' addresses as they've already been tagged. Exchanges have multiple addresses, but for example here's an Ethereum address belonging to FTX: 0xC098B2a3Aa256D2140208C3de6543aAEf5cd3A94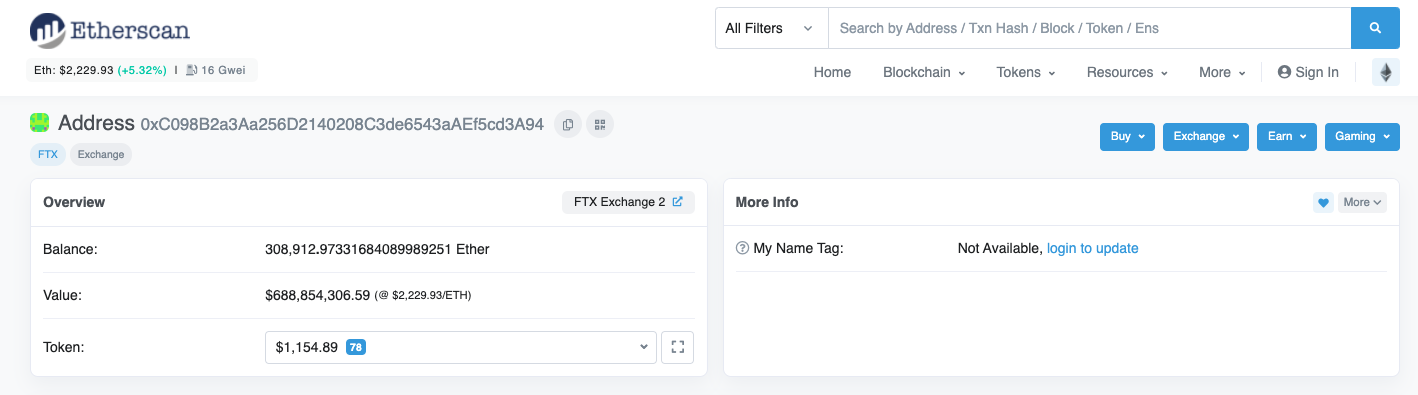
Then through blockchain explorers, we're able to count how many coins were sent into these exchanges and how many were sent out. Then by subtracting the two, we're able to tell what the netflow was. For example, if 1,000 BTC were sent to exchanges and 1,500 BTC were withdrawn that day, then the netflow is -500BTC indicating a net reduction in on-exchange balances. Of course, this is done by comprehensive data solutions such as CryptoQuant or Glassnode that help us easily visualise this data.
The Breakdown
Often, what matters is when there are outsized deposits or withdrawals, smaller ones do not matter as much - this is why we only look at relative netflows. Now that we've broken down what inflows and outflows are, let's see what they mean.Exchange Inflows: Deposits
When there are large deposits hitting an exchange, this usually means there's upcoming selling pressure or at least rotation out of that coin. Think about it, what purpose would someone have to take their coins out from cold storage and into an exchange?
We personally use CryptoQuant to get our data and here's a historic example of large bitcoin inflows leading to market prices dropping.
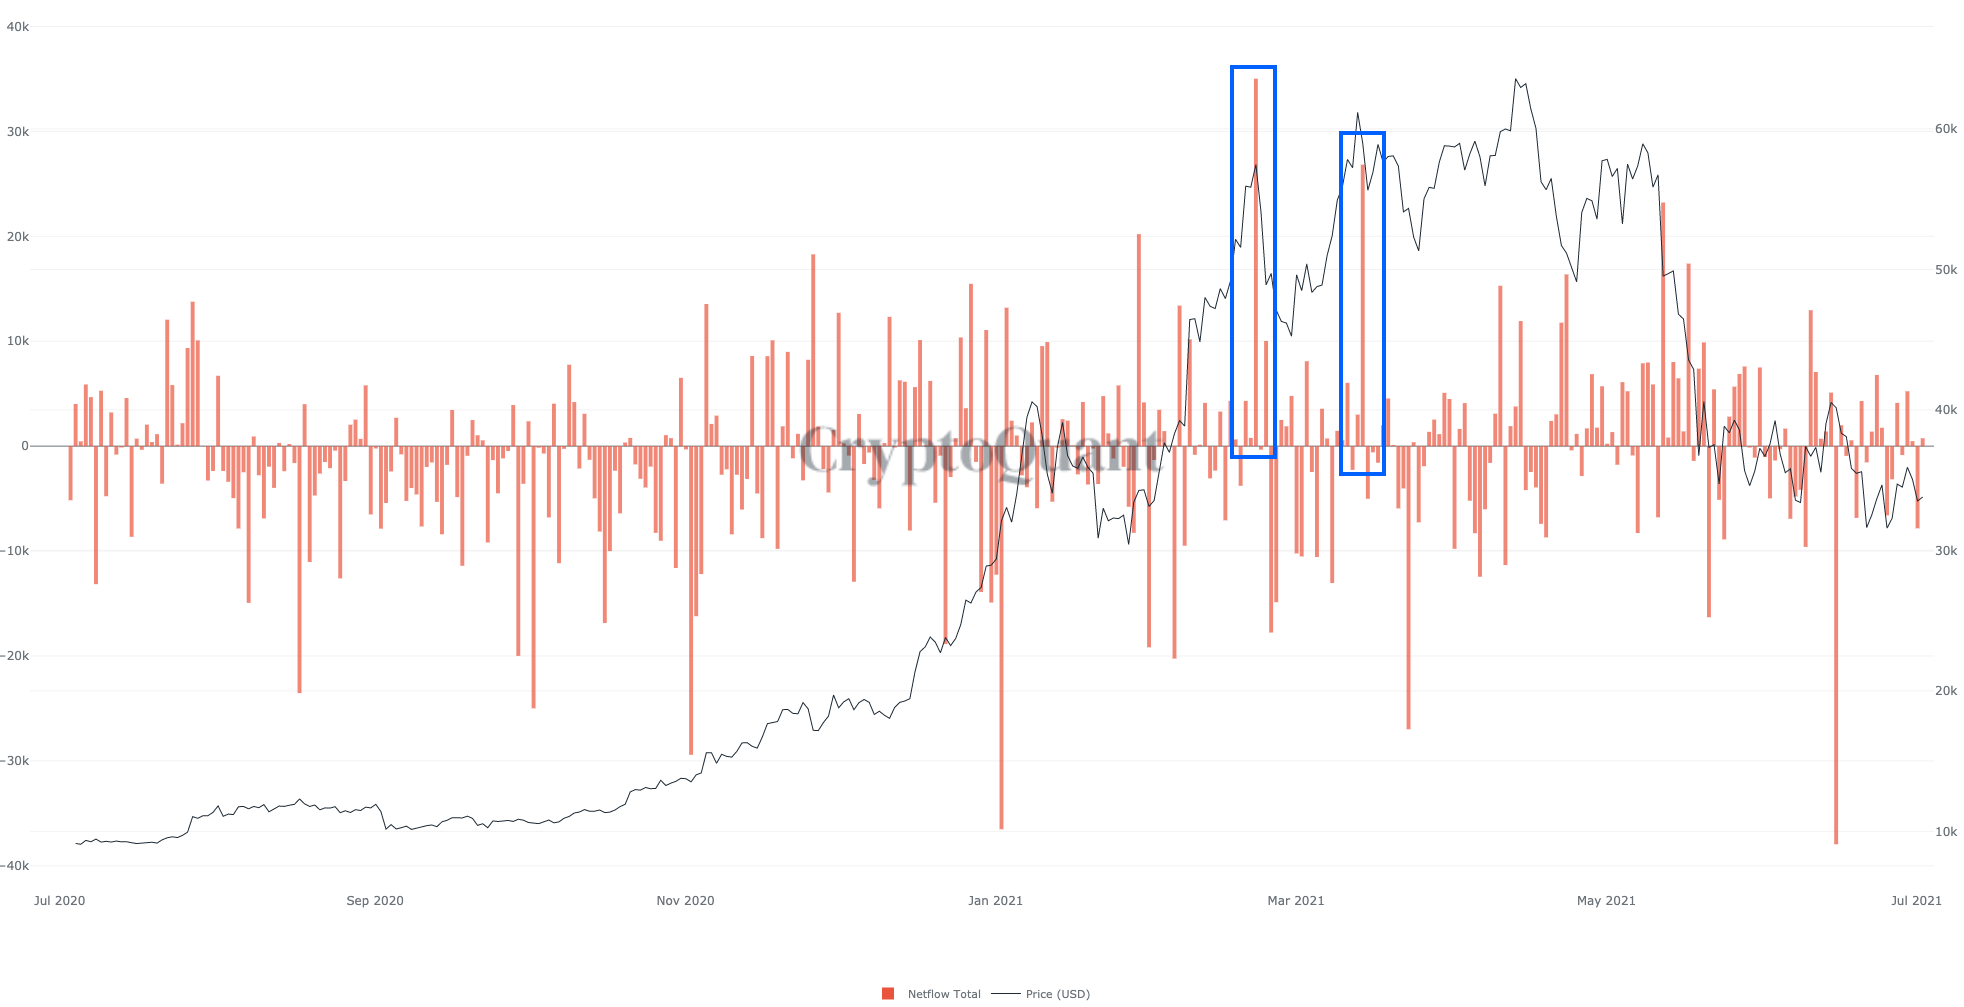
On the graph above, we can see two large BTC inflows hitting exchanges and then most probably directly leading towards drops in price.
Exchange Outflows: Withdrawals
Outflows represent withdrawals and that communicates a reduction in the "available to buy" supply. Of course there are OTC (over-the-counter) desks but the supply reduction from outflows is a reasonable assumption to make.
We'll cover BTC & ETH outflows here because they do differ.
- BTC Outflows: This tends to be a bullish signal as there's nowhere else to go and sell these coins, except on OTC desks which are not as commonly used as exchanges.
- ETH Outflows: These are trickier because withdrawn ETH can still be sold on-chain through decentralised exchanges (DEXs). However, when a very large outflow takes place from an exchange, it is very rare that this person is doing so just to go and sell it on a DEX. So it is reasonably to view this as a bullish signal, just not as straightforward as bitcoin outflows
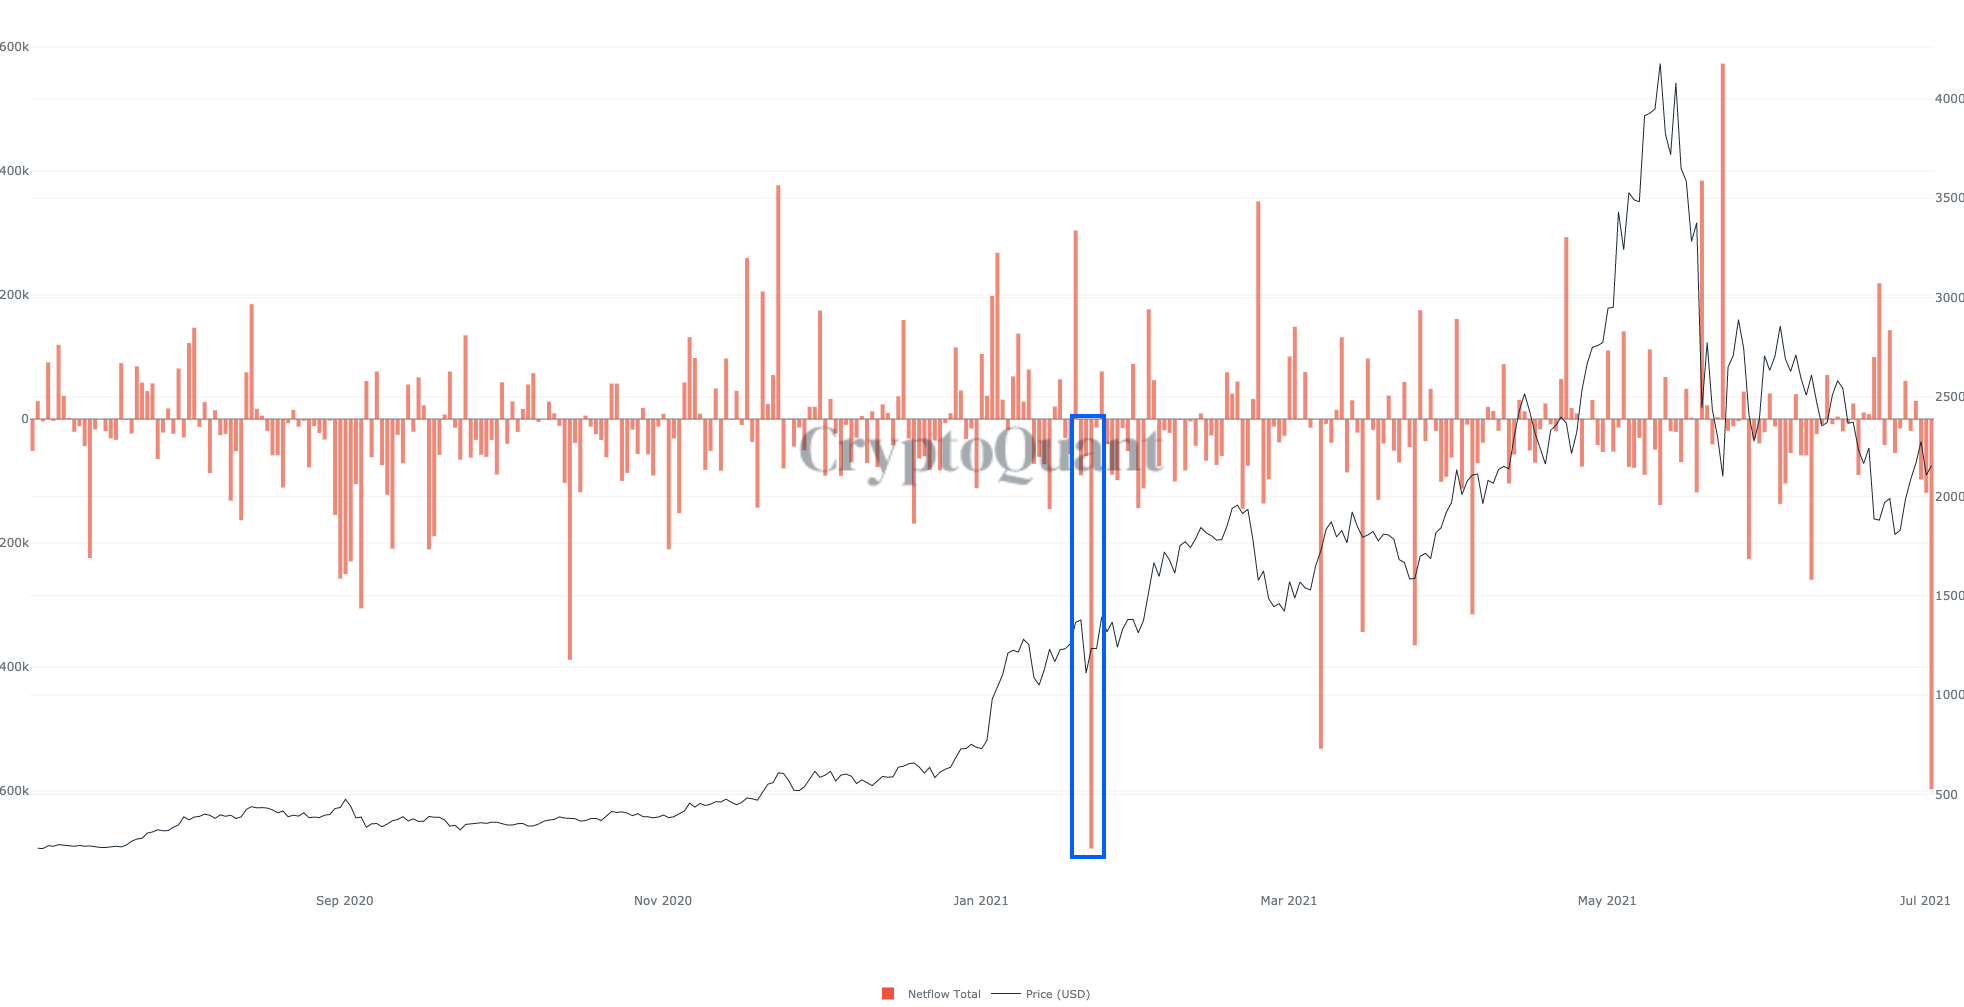
On the graph above, we see a large ETH withdrawal that then led to further upside continuation. Outflows don't impact price right away in most cases though, as they're not upcoming buys but rather previously bought coins that are now being withdrawn. However, large outflows are watched by traders whom may act upon such information by bidding on the asset (i.e. buying). The real effect though comes in later if demand keeps increasing, as there aren't enough coins available to be sold which then increases its price.
You're looking at the chart though and thinking, isn't there any better way to visualise this data for a more zoomed out view? And the answer is yes.
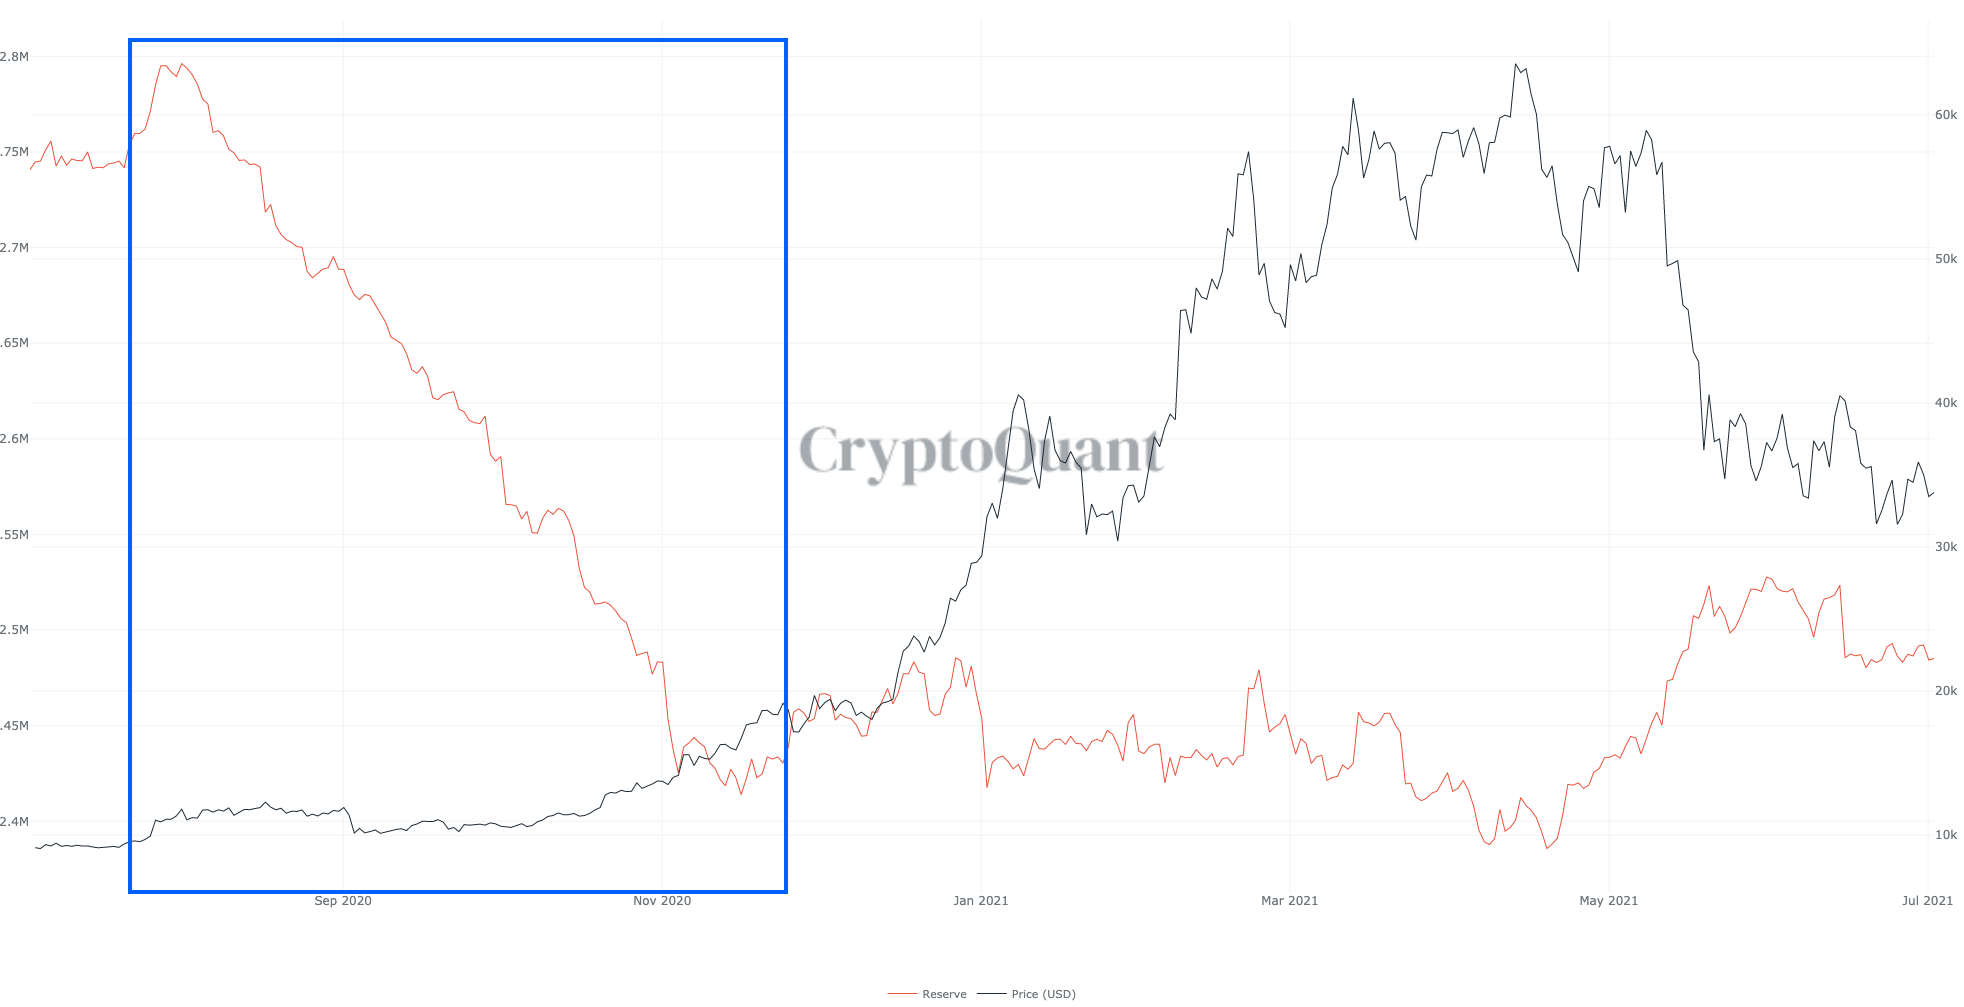
The other chart to look at is exchanges reserve as that shows us how many coins are on exchanges. We can clearly see when there are increases in the amounts available on exchanges which are a direct result of inflows (deposits) and when the reserves drop as a result of outflows (withdrawals).
During the last quarter of 2020, there was a significant amount of BTC being taken off exchanges while price was still trading around $10,000-$15,000. That was a great indication of what would occur to price later on as demand massively increased. What happened afterwards was the break of the $20,000 top leading towards $60,000+ over a few months only.
Can't leave a journal without a piece of alpha.
[caption id="attachment_128367" align="aligncenter" width="1964"]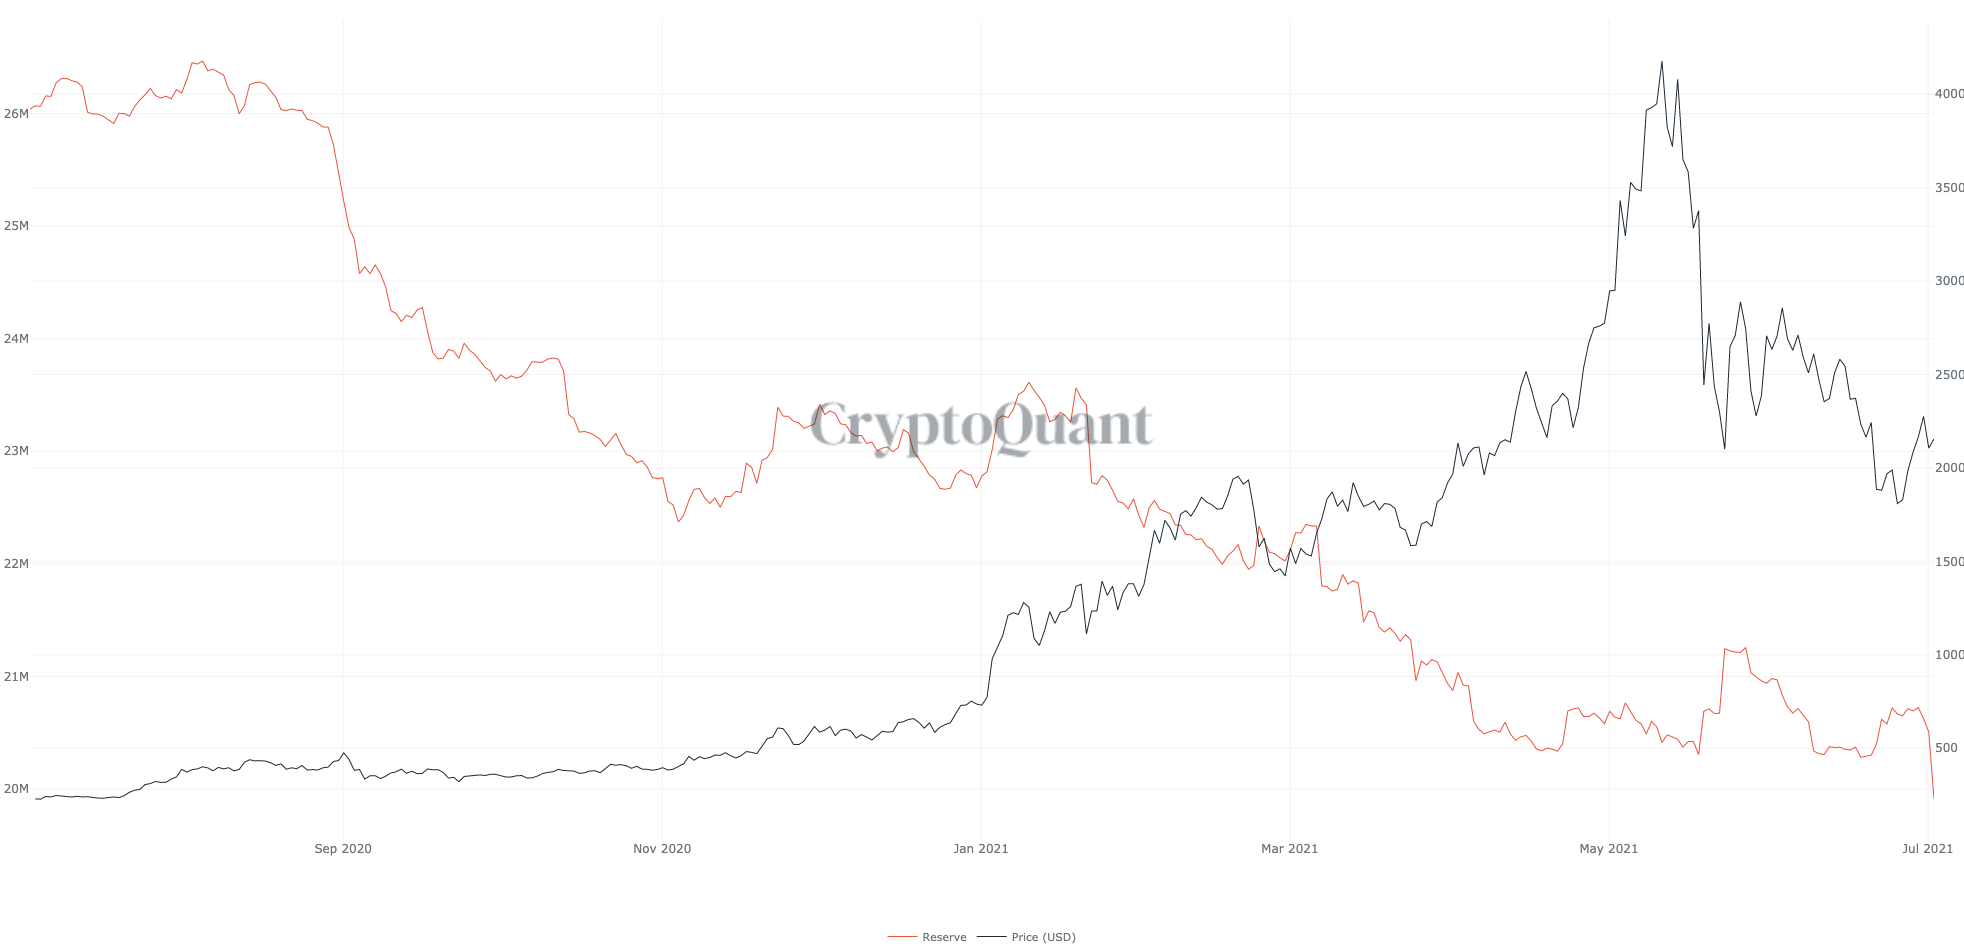 ETH Exchanges Reserve have hit an all-time low[/caption]
Recommended from Cryptonary


