
During Volume 38, the market was just starting to pierce into new all-time highs and mainly via BTC. Prices back then?
- Total MCap: $0.87T
- Altcoins MCap: $0.26T
- BTC: $32,894
- ETH: $979

LFG
Disclaimer: Not financial nor investment advice. Only you are responsible for any capital-related decisions you make, and only you are accountable for the results.
Market Sentiment
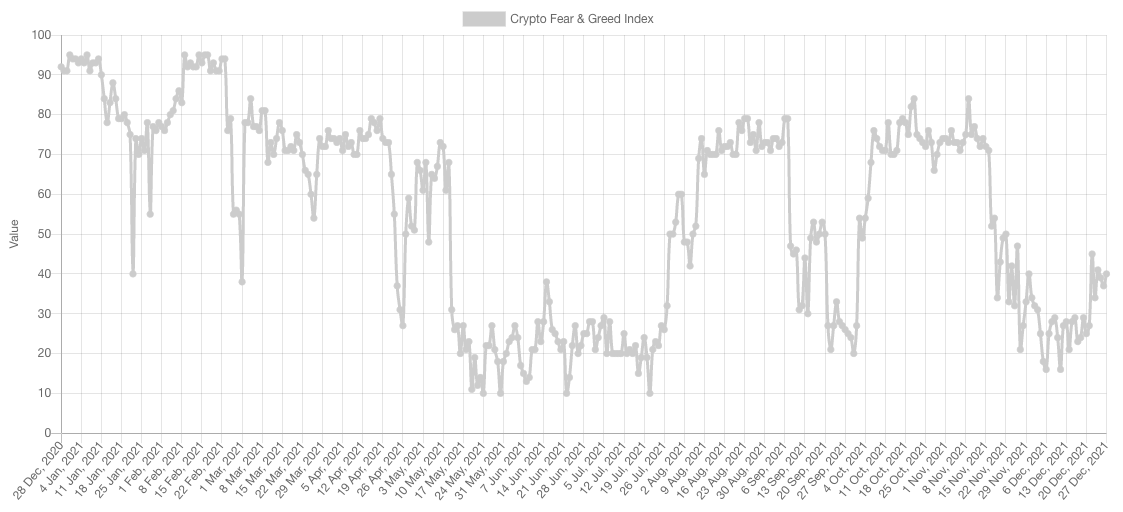
Sentiment seems to be recovering faster than prices, but it remains in the "Fear" range. Let's take a look at the funding rates which will tell us if there is any excess euphoria on the grounds.
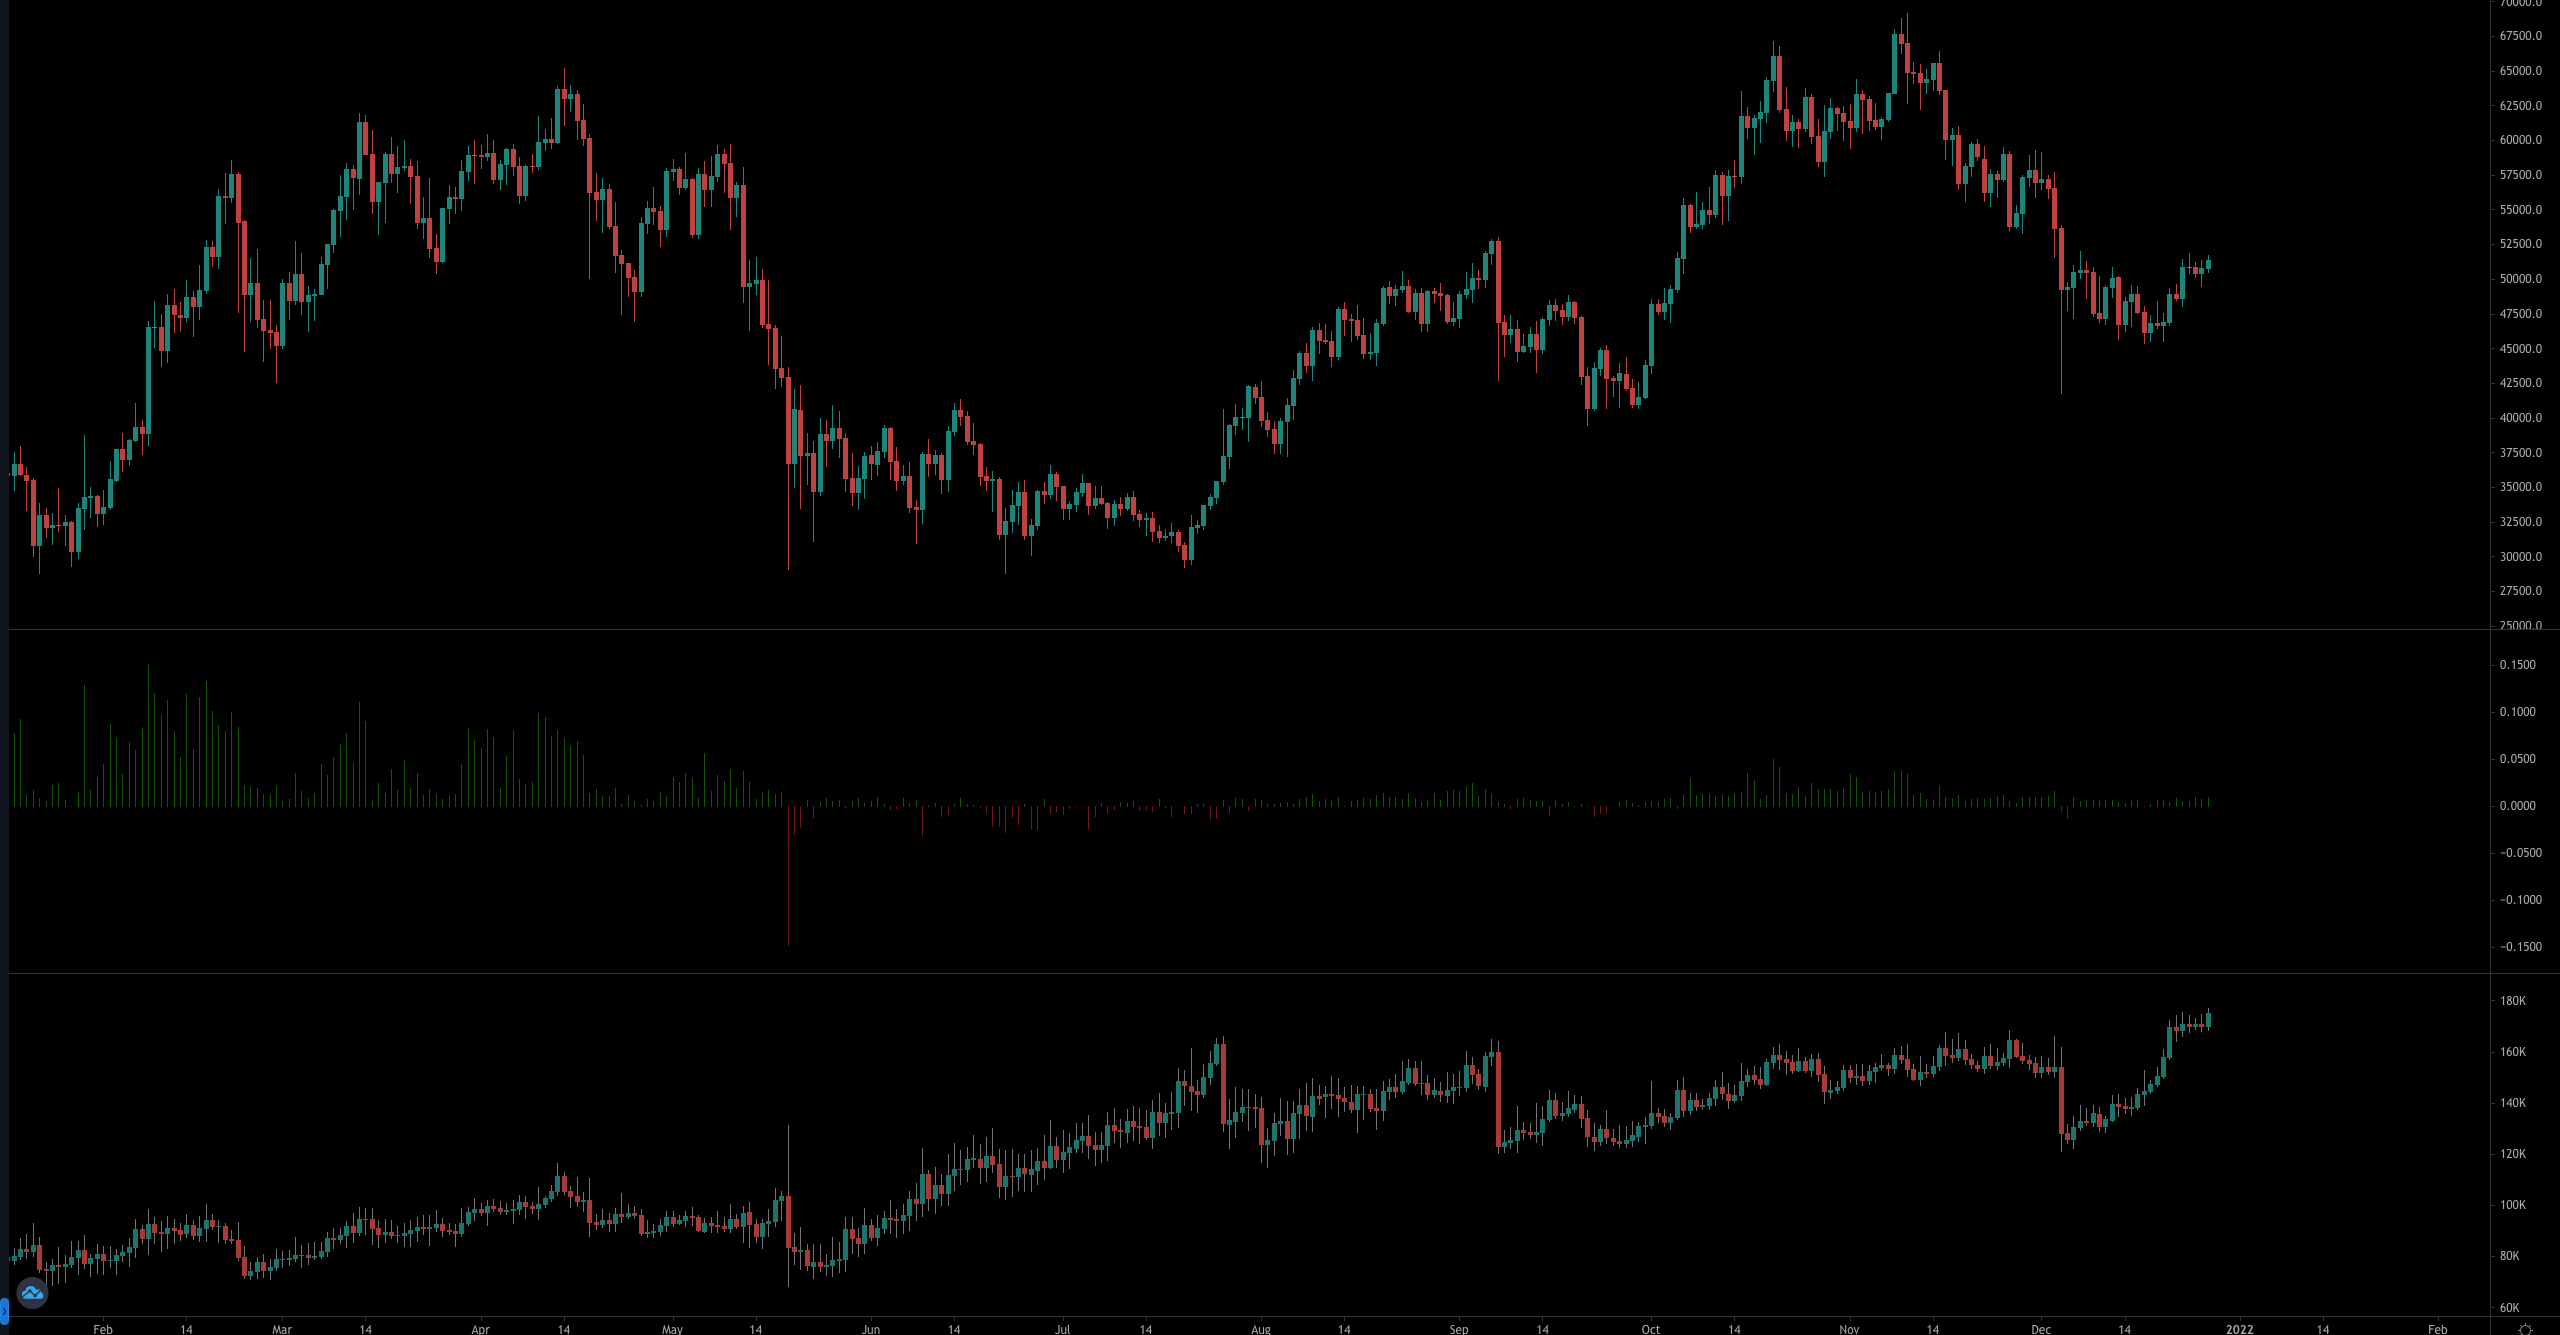
We've got three graphs piled on top of each other, here they are from top to bottom:
- BTC's price chart
- Funding Rate (aggregated from all exchanges)
- Open Interest (for stablecoin margined contracts)
Market Indexes
Total Market Cap
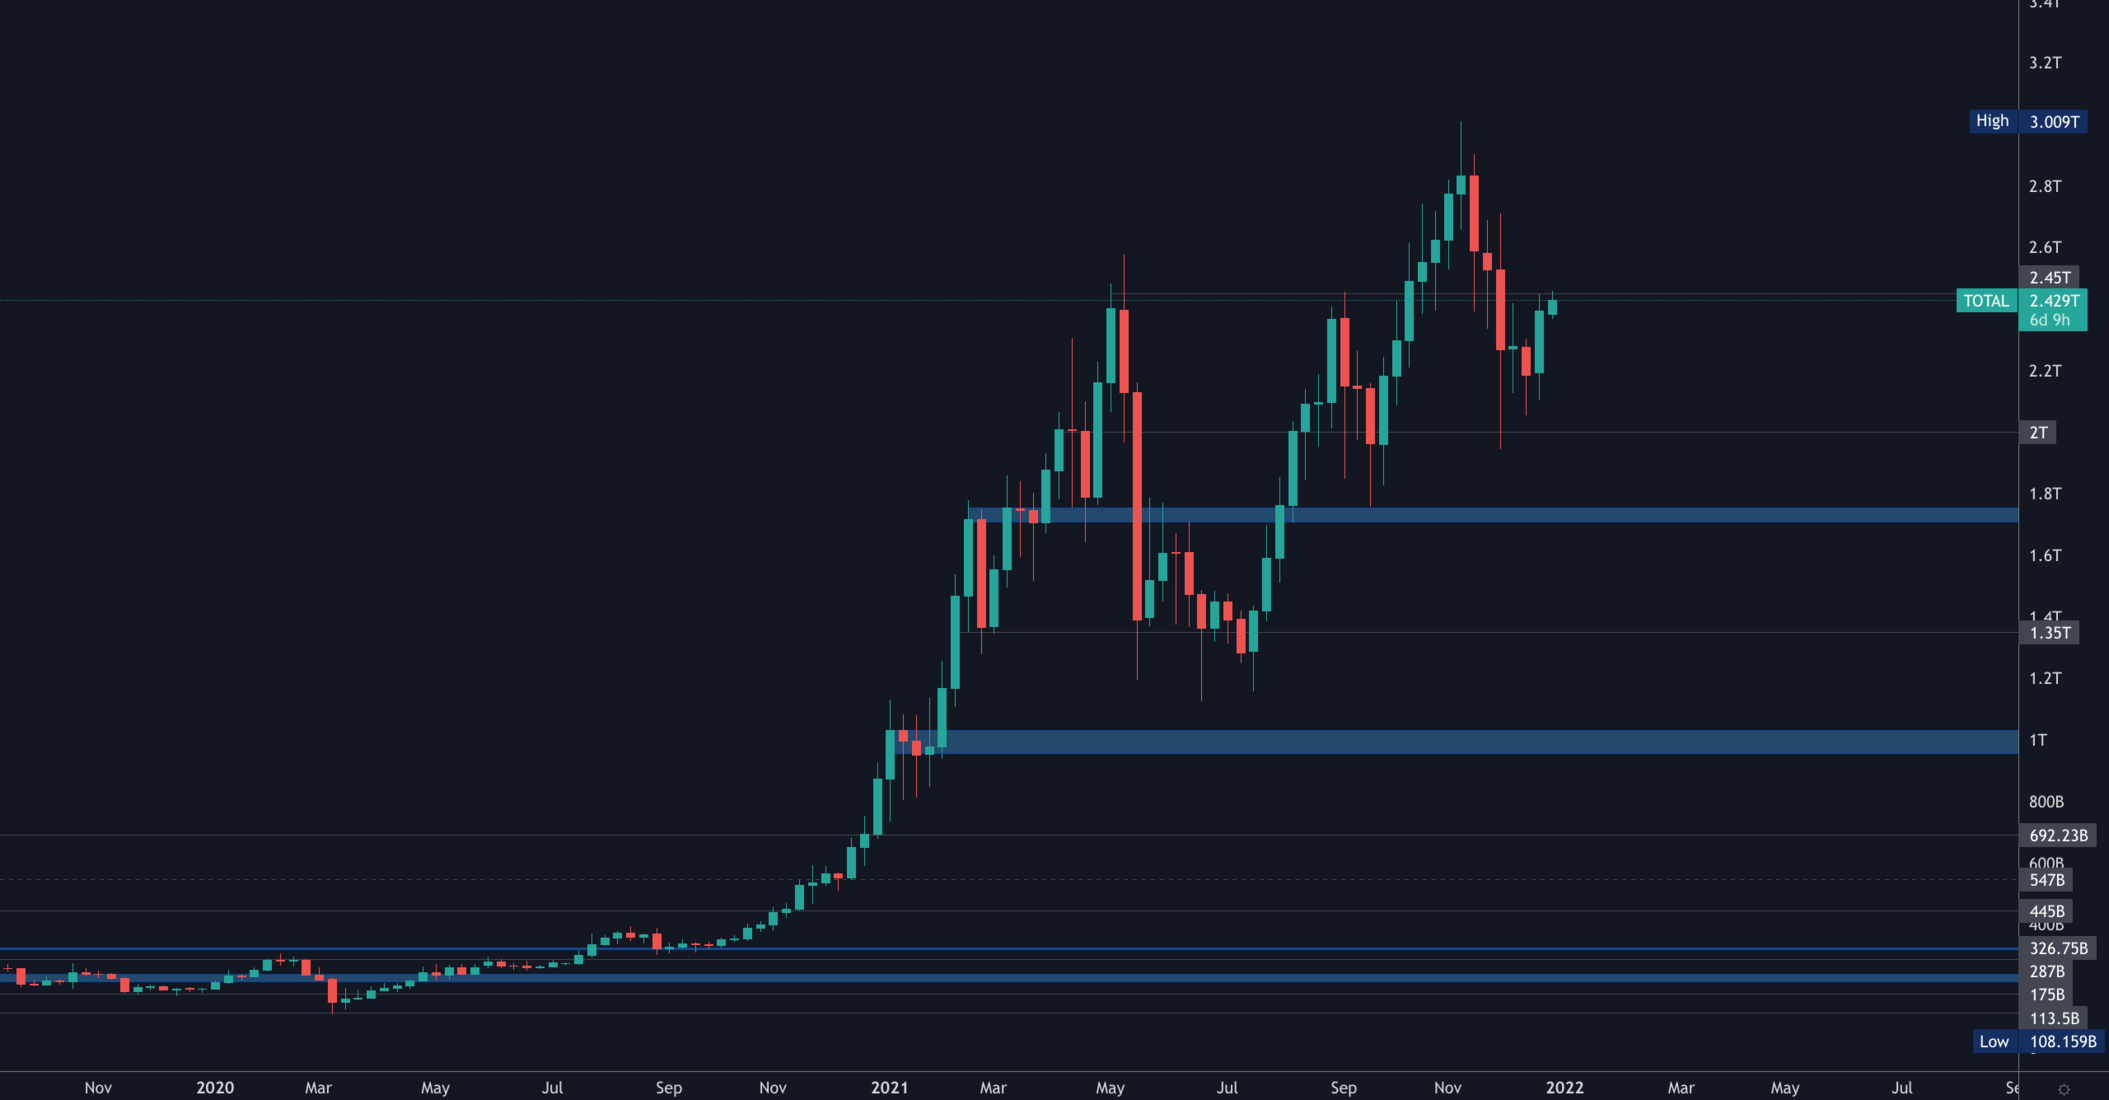
From a pure technical perspective, we have the Total MCap retesting $2.45T as resistance which can lead towards another test of $2T. This can only be invalidated by a reclaim of $2.45T which will then lead towards $3.T+ - this breakout is one we're monitoring for on the daily timeframe.
Altcoins' Market Cap

We have a similar situation here with the Alts MCap coming into resistance at $1.5T which can initiate a second test of $1.115T. This of course can get invalidated in the same manner as the previous chart; a daily closure above resistance.
Bitcoin
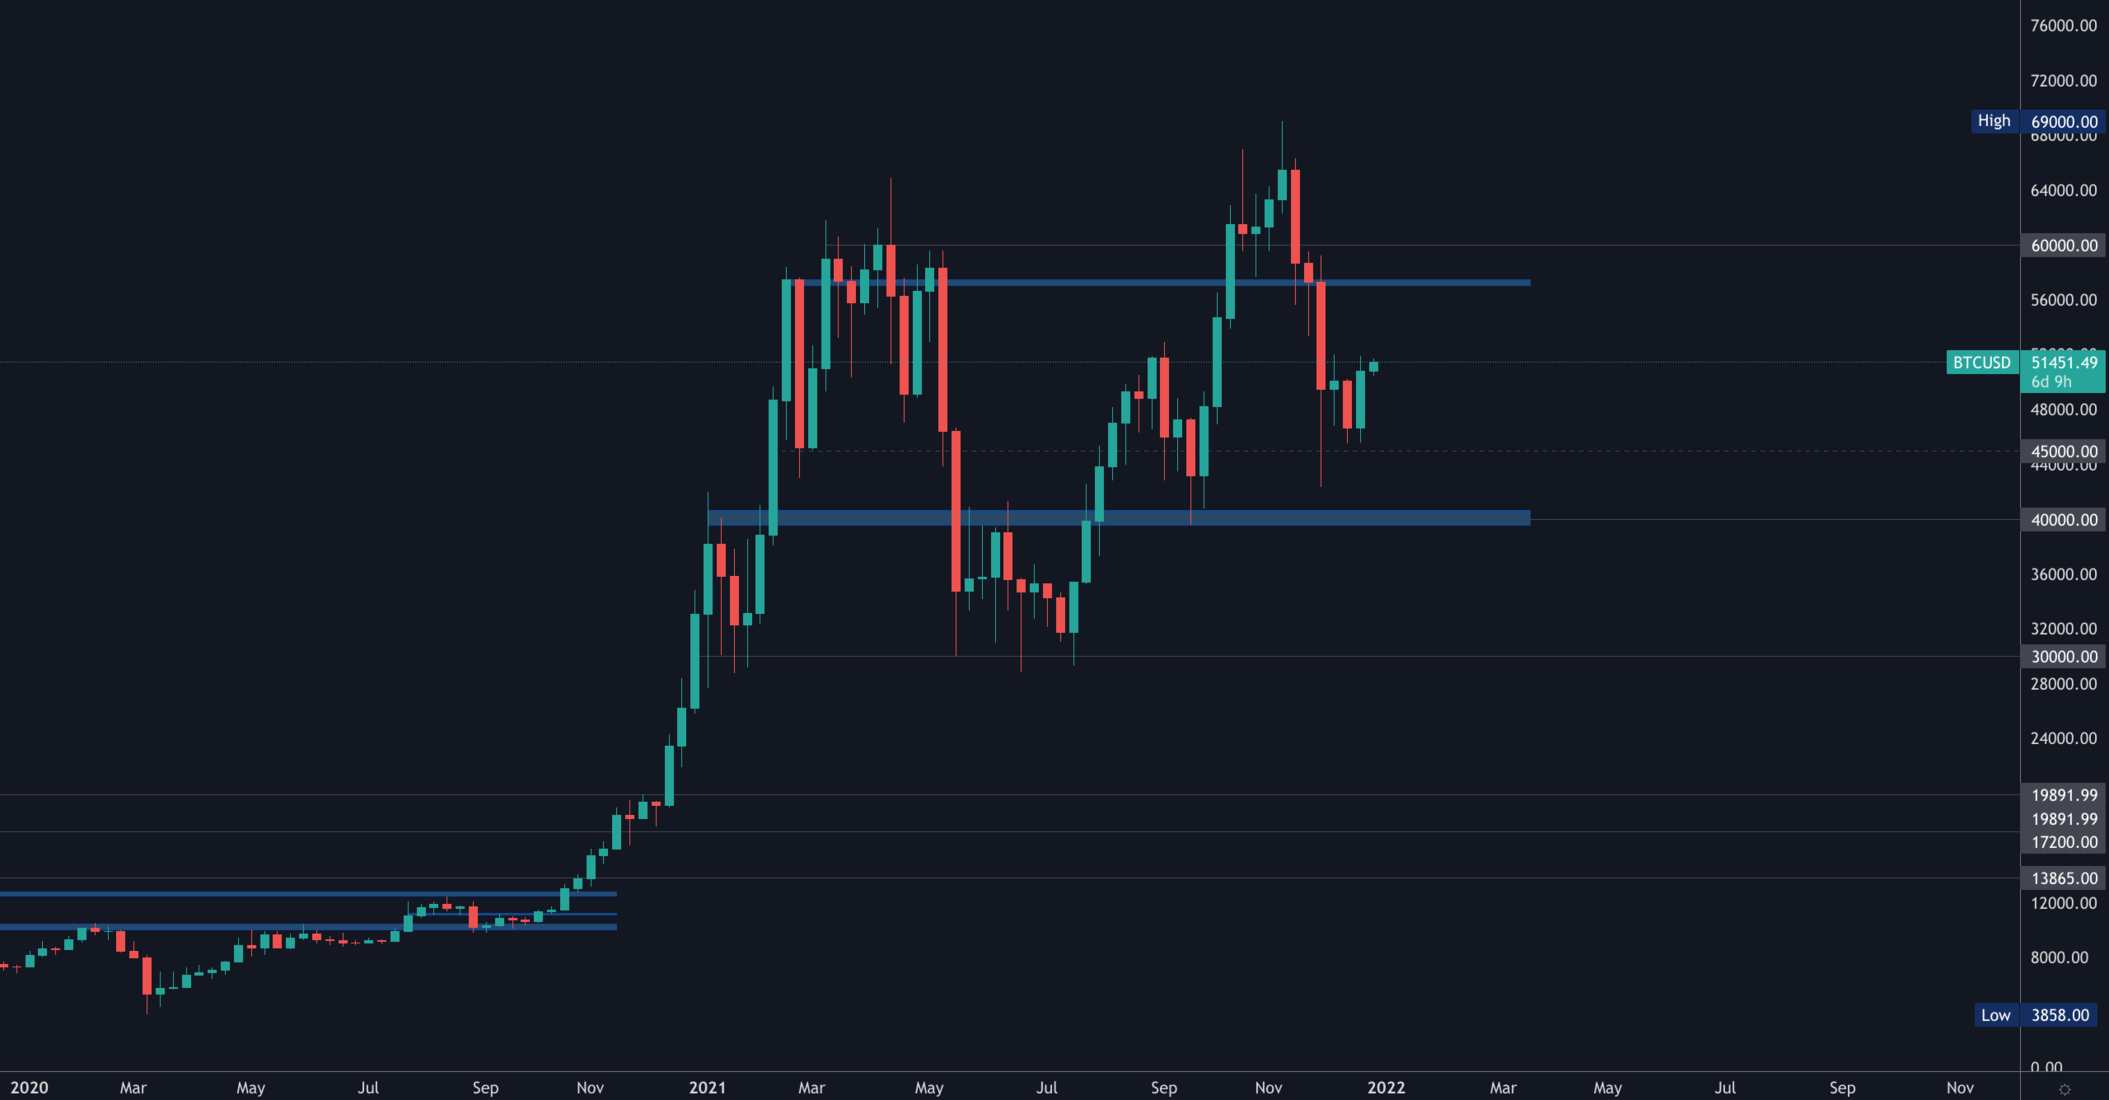
Bitcoin is also coming into resistance at $53,000 but it has registered a bullish engulfing candle on the weekly timeframe which may help propel it through that resistance. If that were to happen, then $60,000 would become the next logical target.
Ether
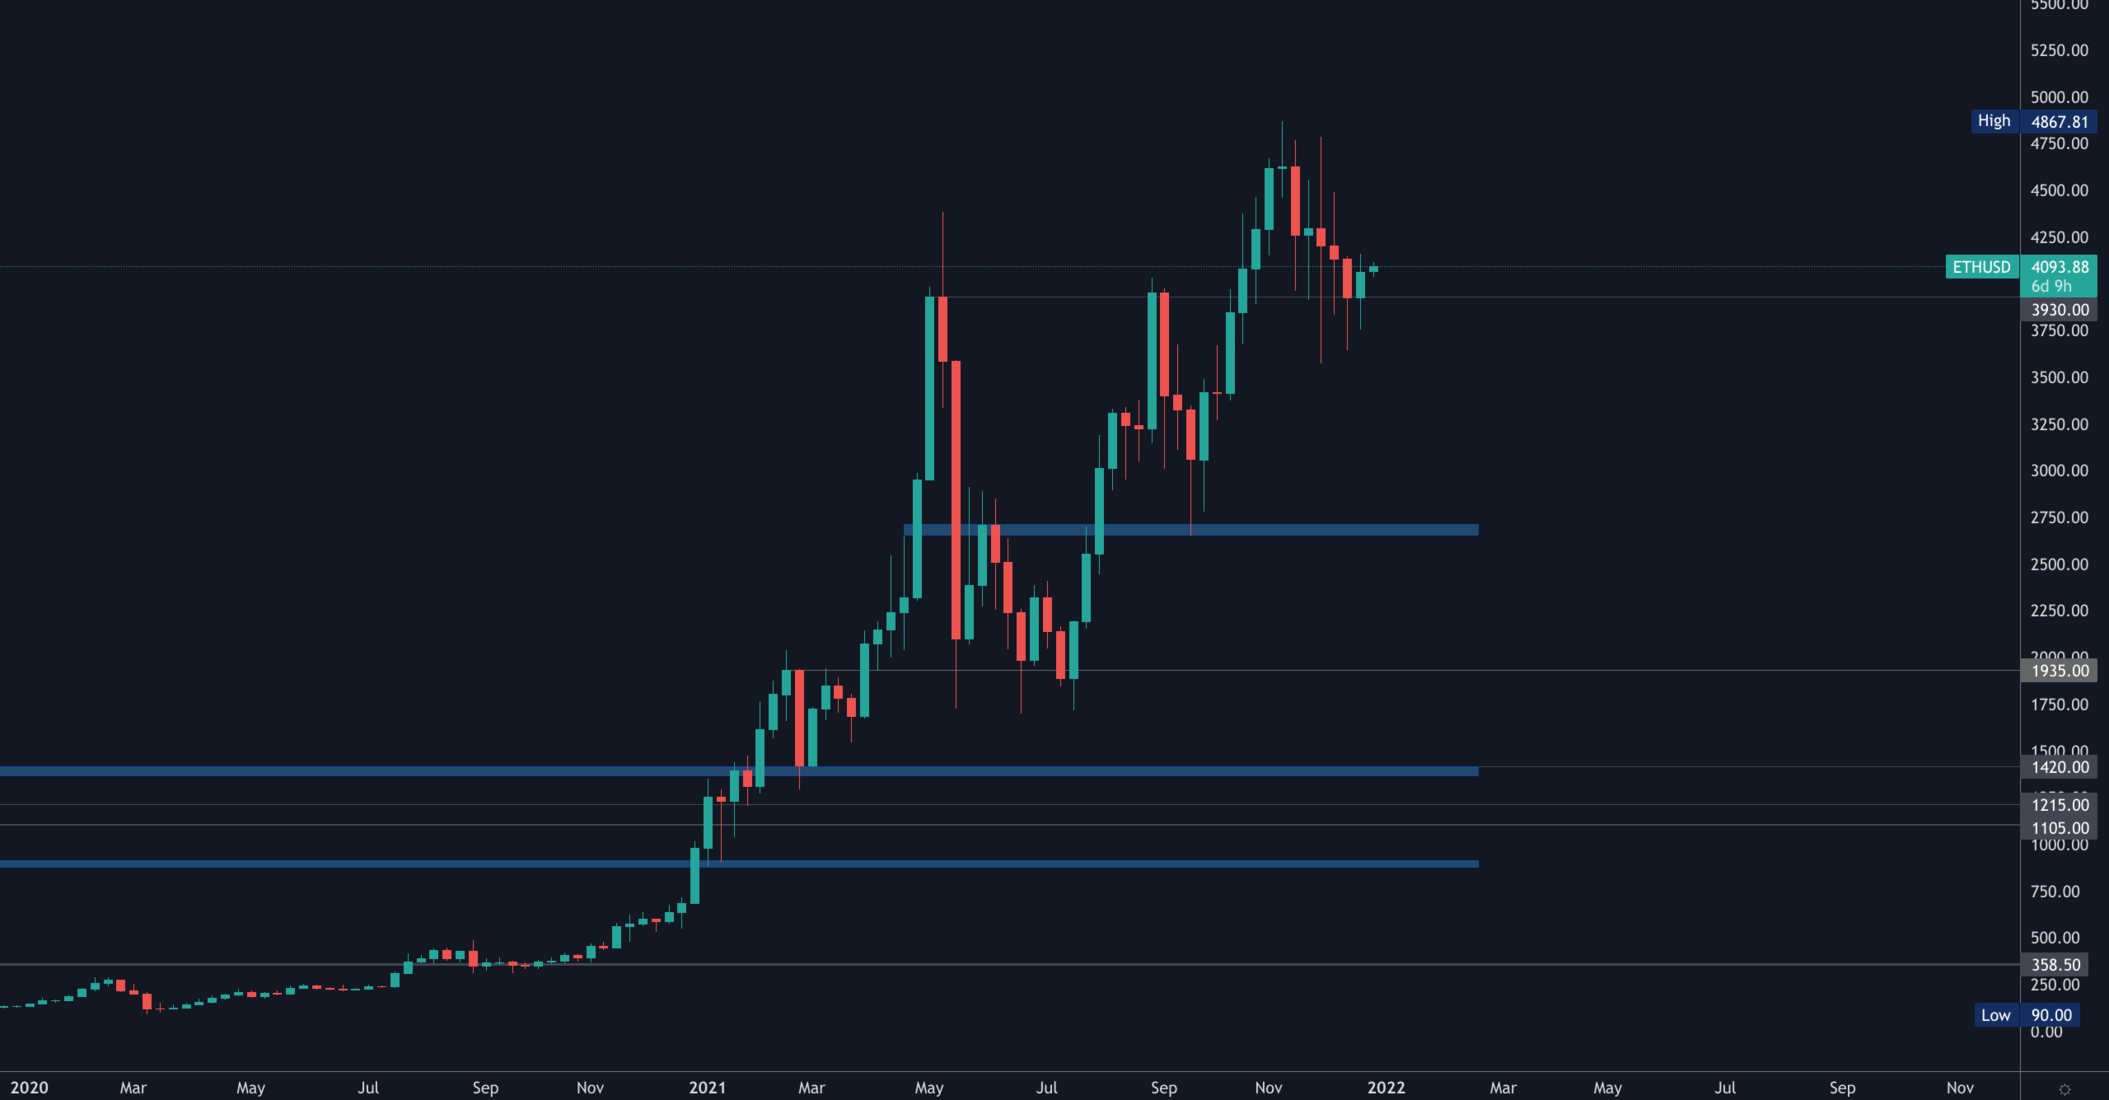
ETH is looking better than any other chart as it has broken through the $3,930 resistance and is only retesting it for support which keeps it in a bullish market structure.
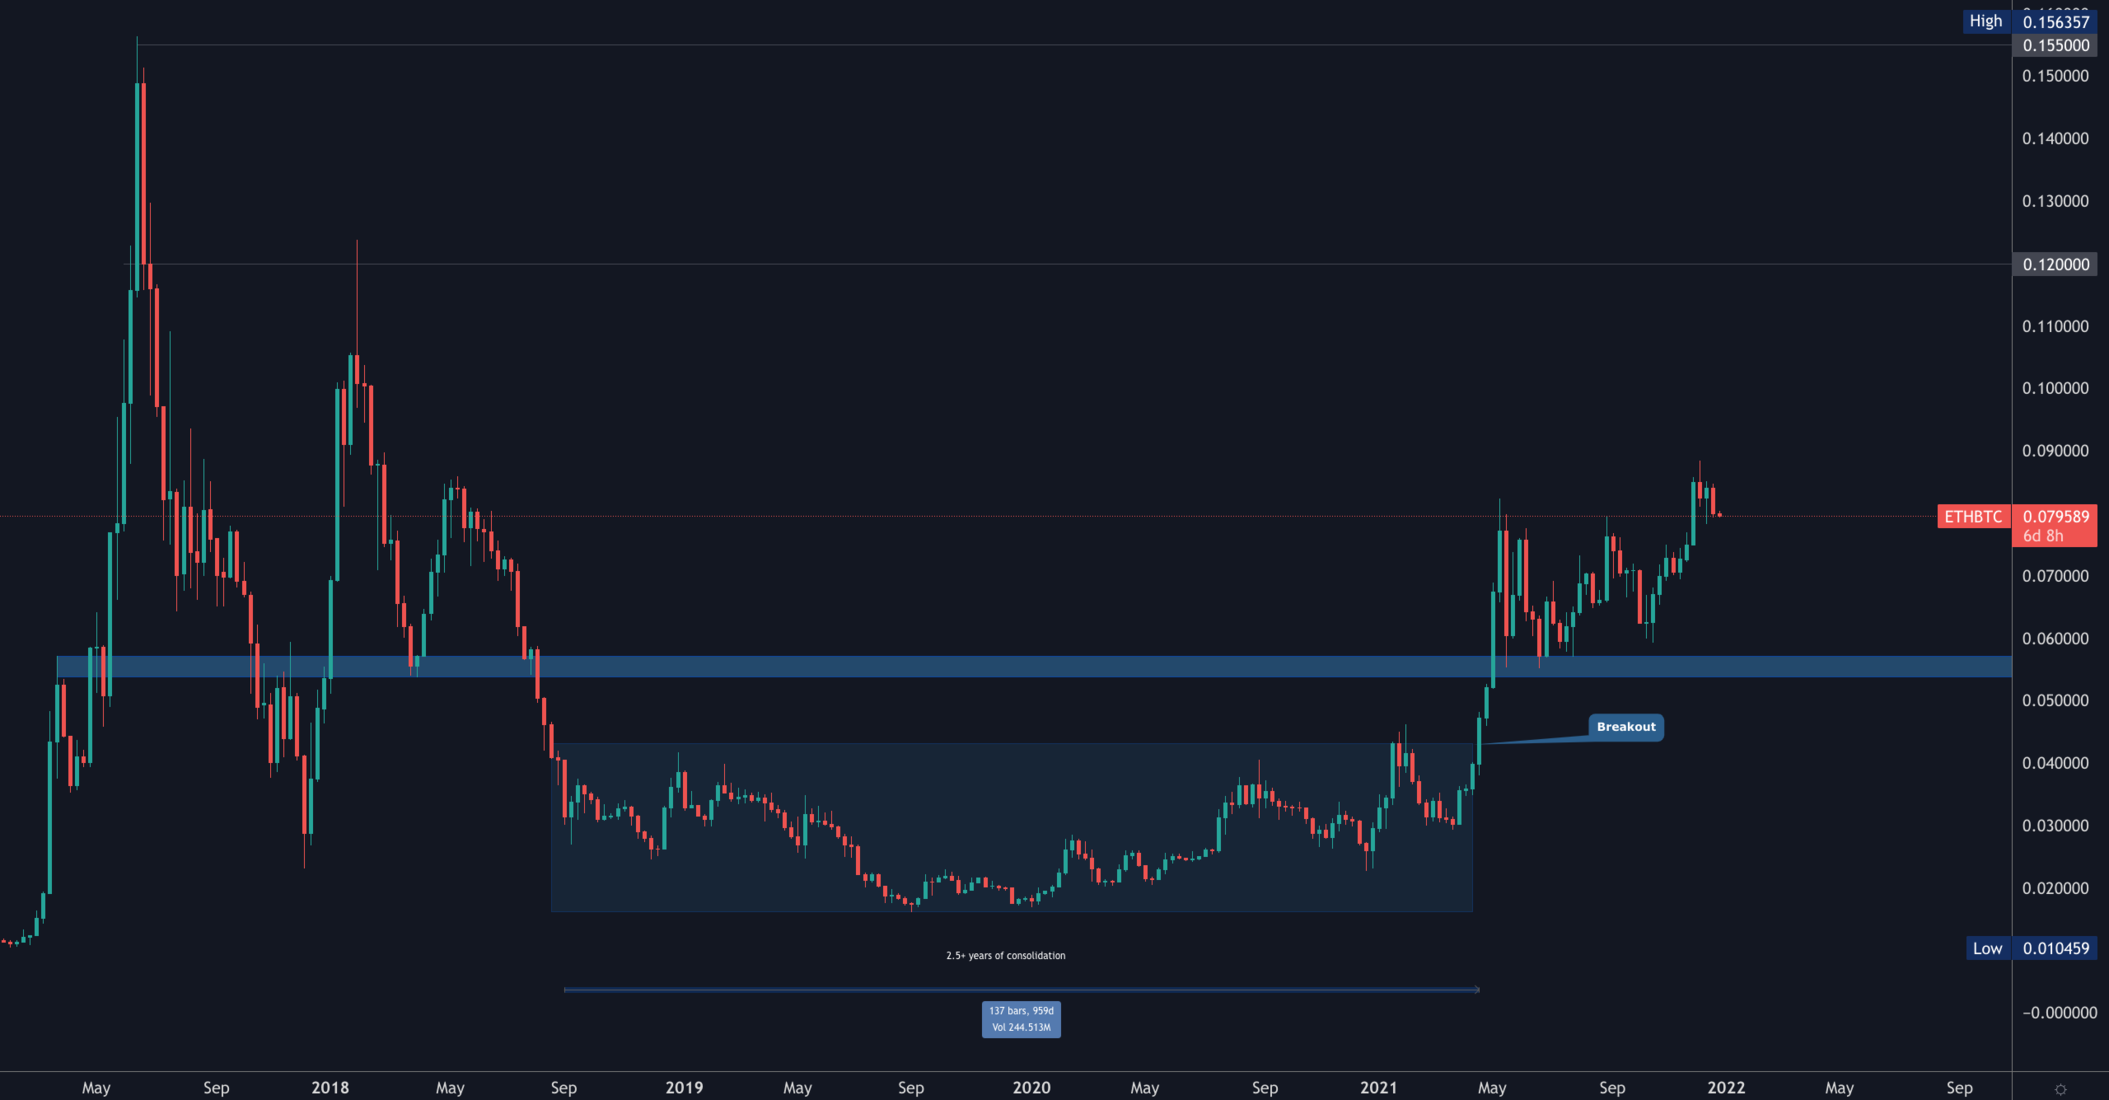
The same bullish market structure can be seen on the ETH/BTC ratio as price is continuously registering higher highs and higher lows. The next key level for this ratio is 0.12 which represents a +50% advance in price.
DOT
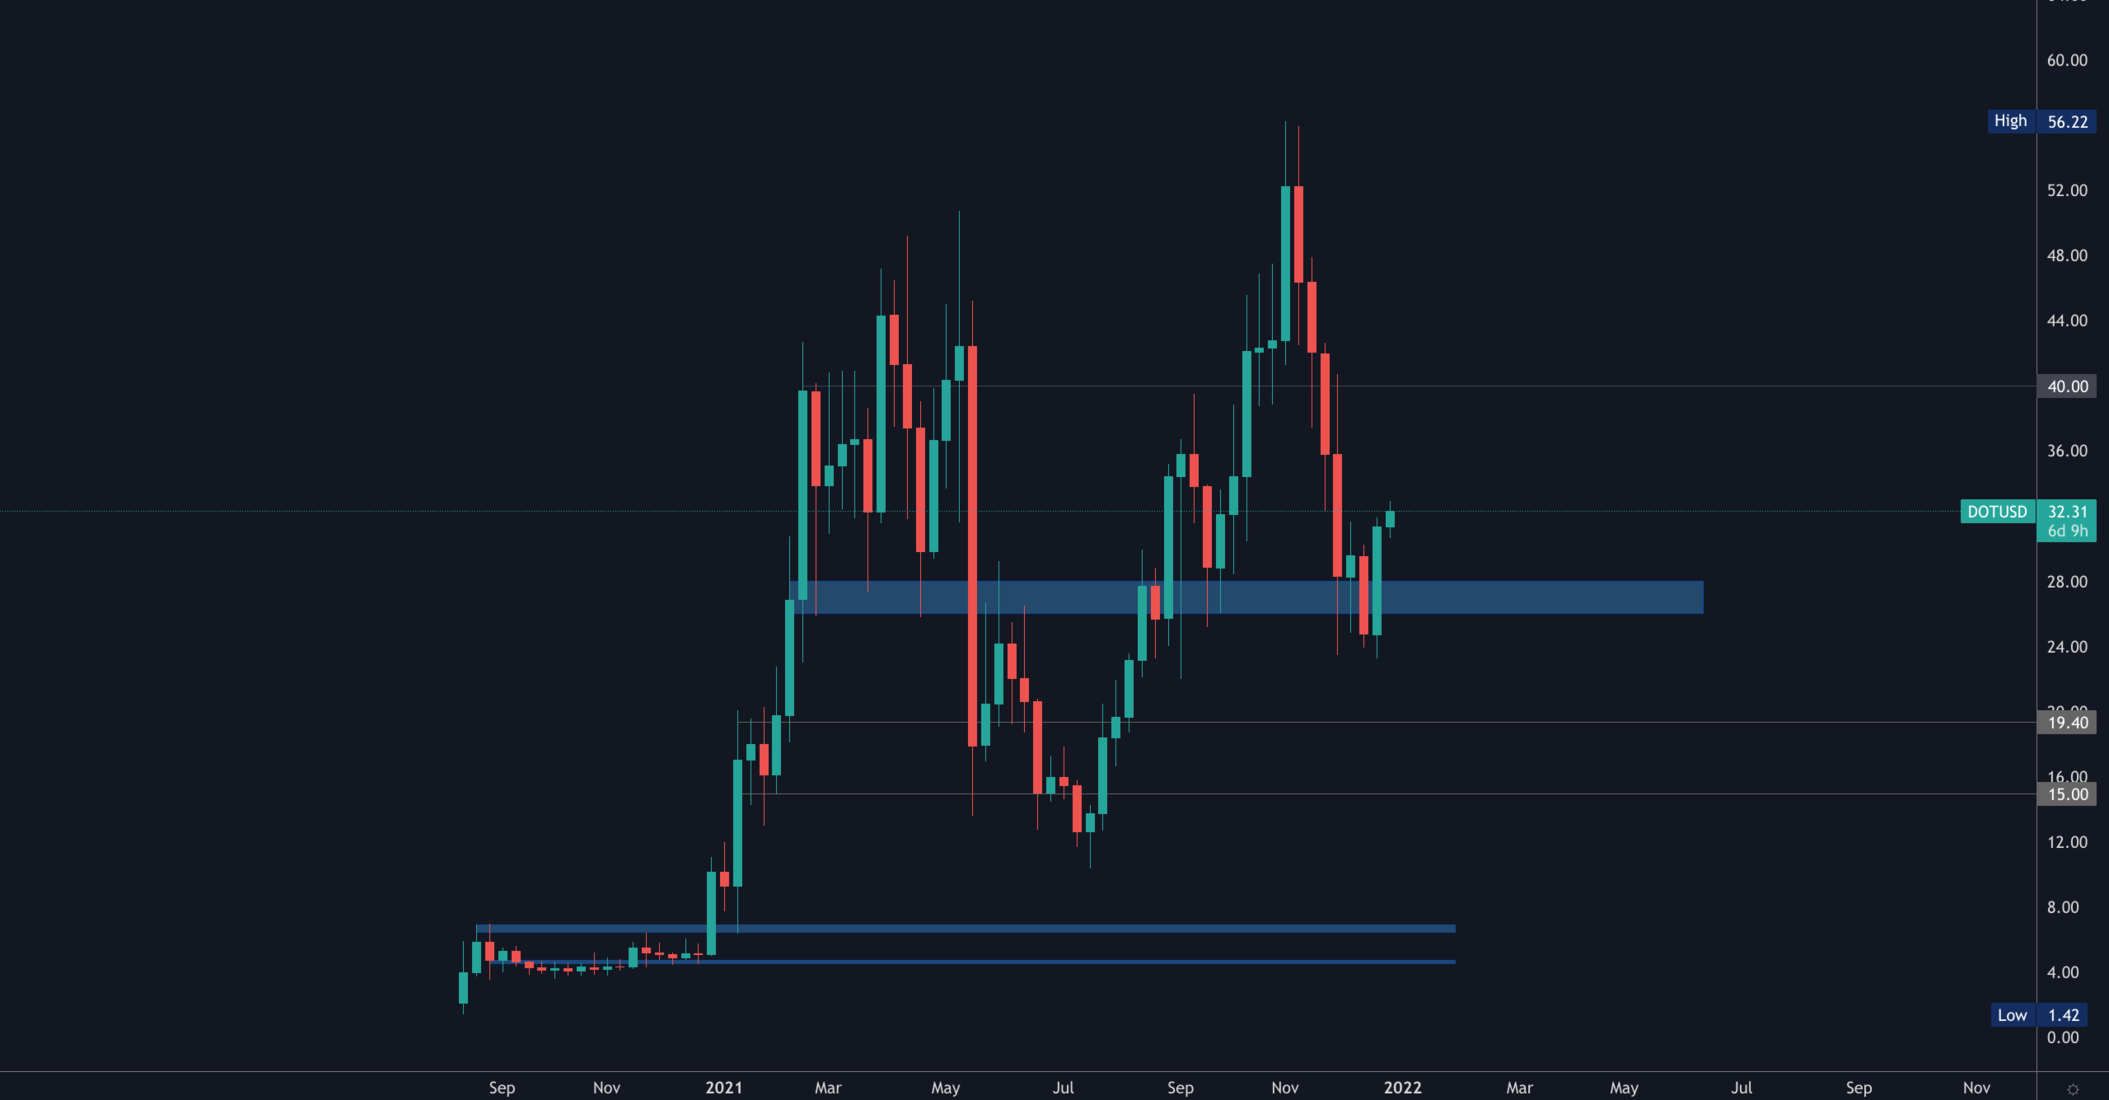
DOT has registered a massive bullish engulfing candle on the weekly timeframe sending it back above the [$26-$28] liquidity area. This sets it up for a rally towards $40 once again - third time's a charm?
SNX
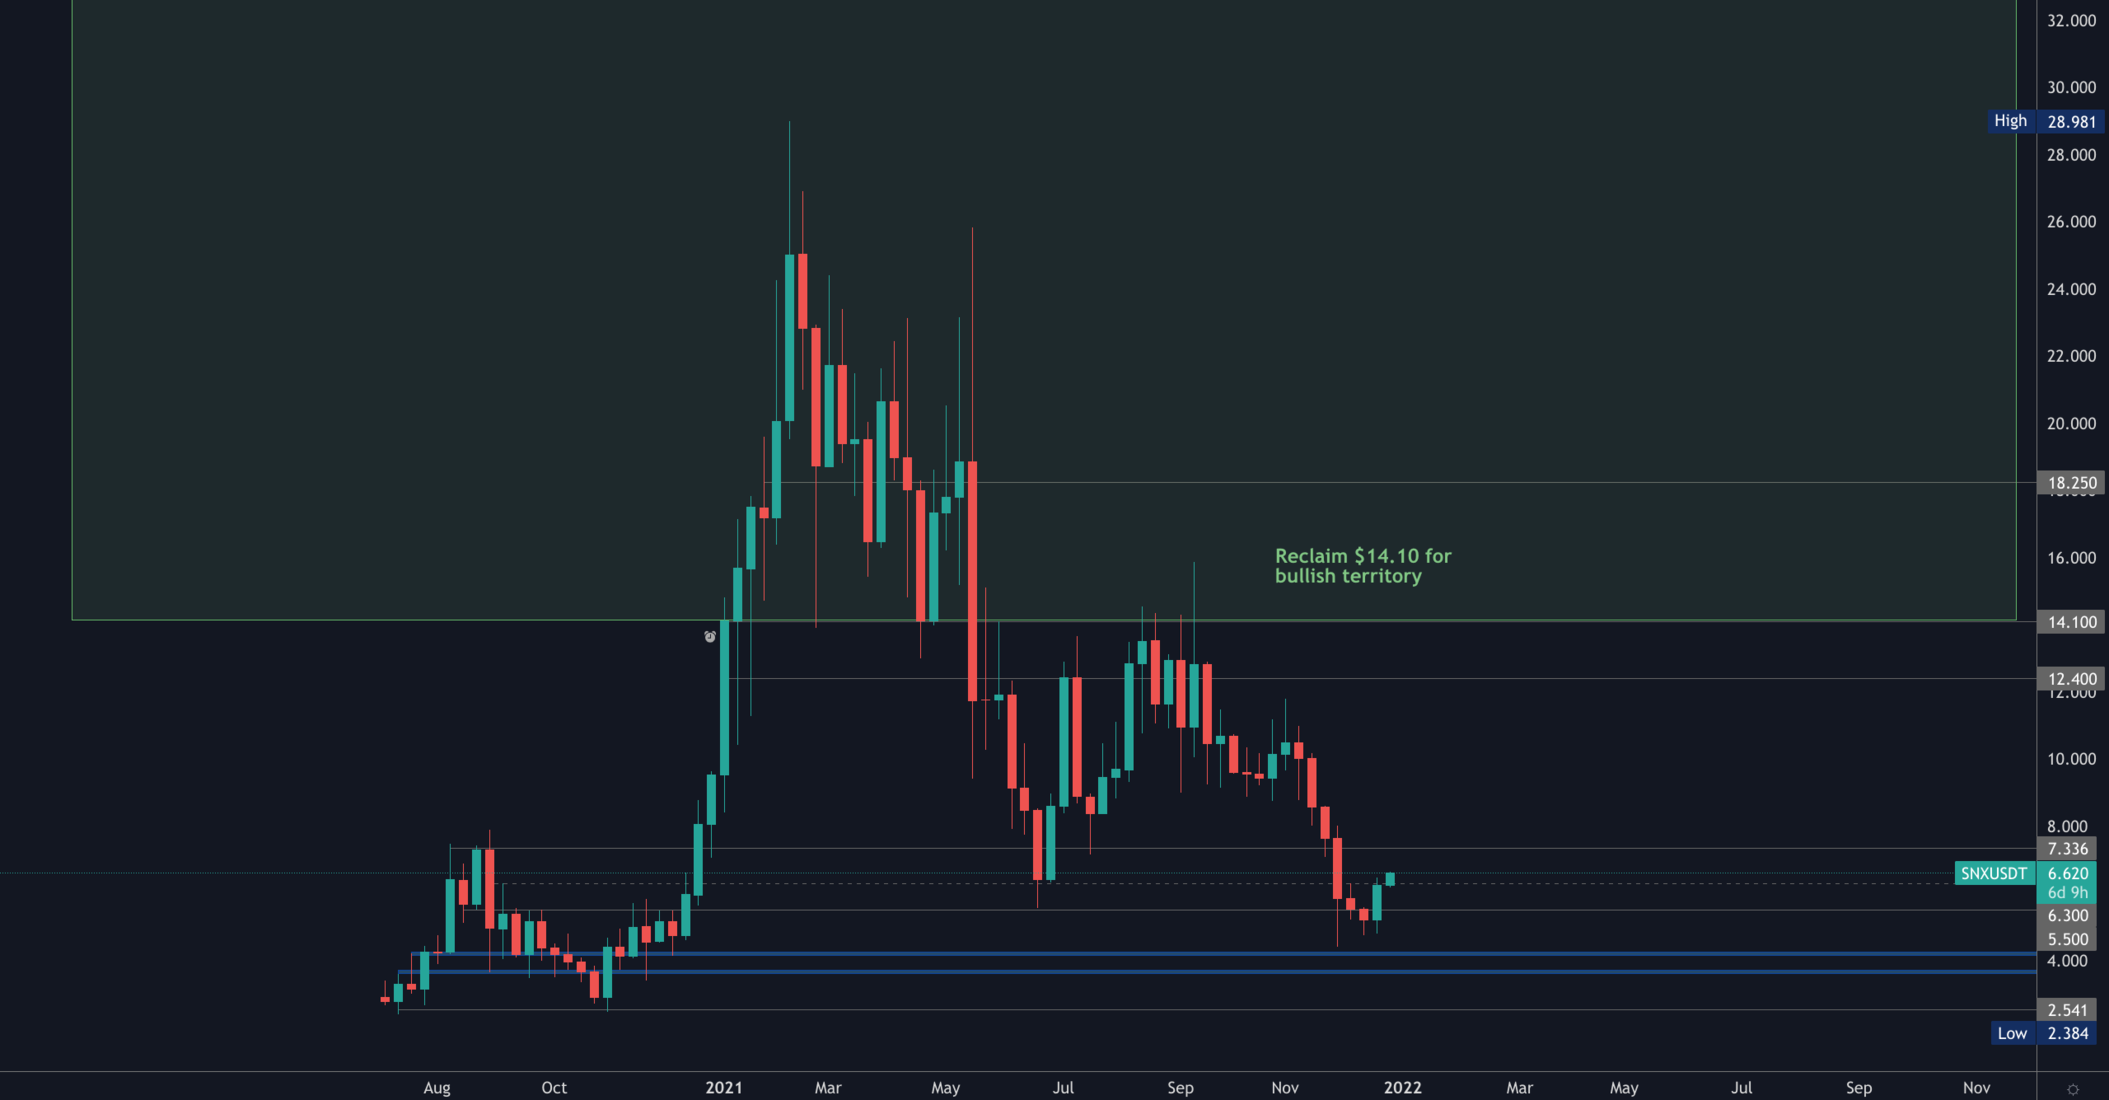
Another weekly bullish engulfing candle which sets us for a test of $7.50 next.
RUNE
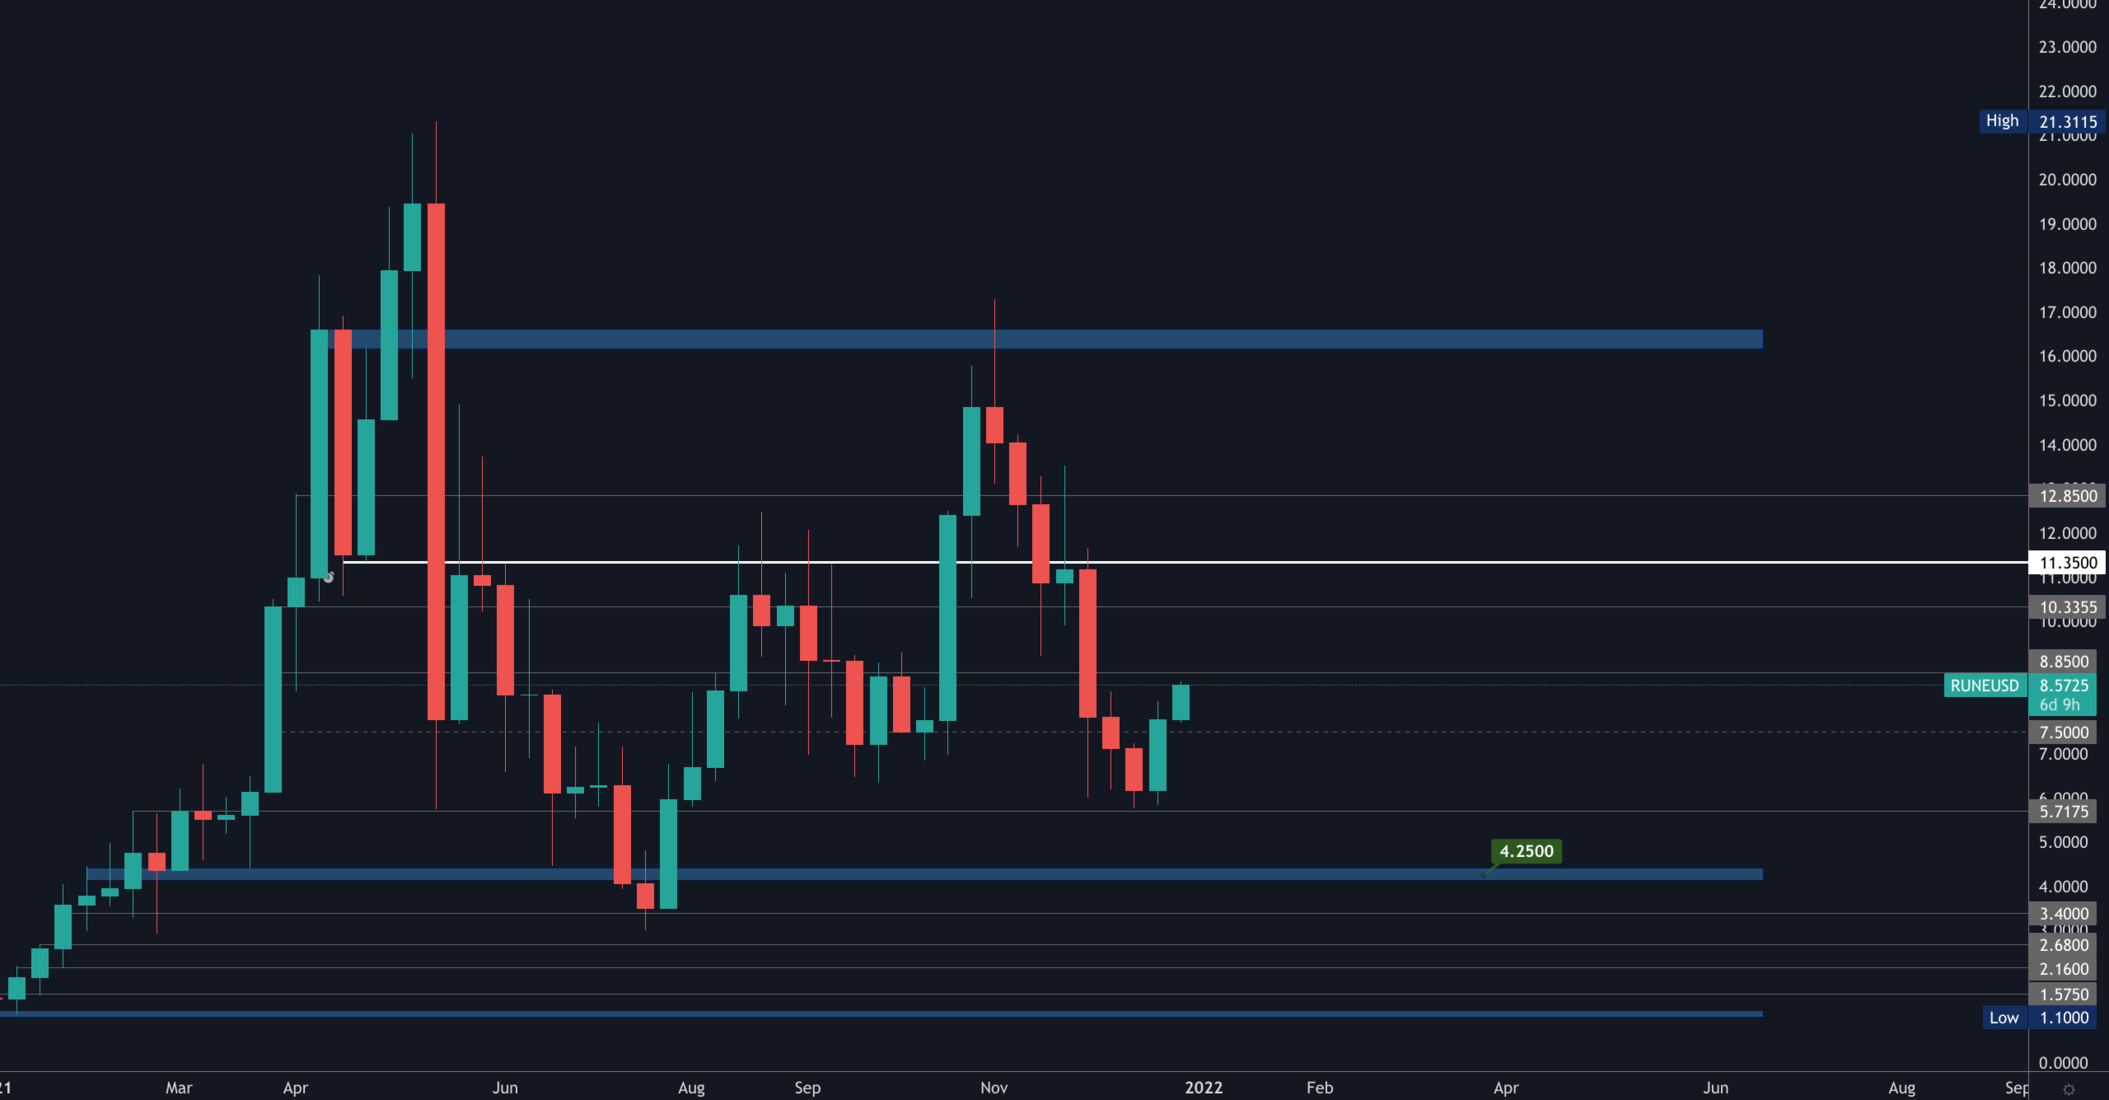
And another one! This tends to be a strong bottom indication in crypto which likely means $11.50 is up next on the cards here.
SOL
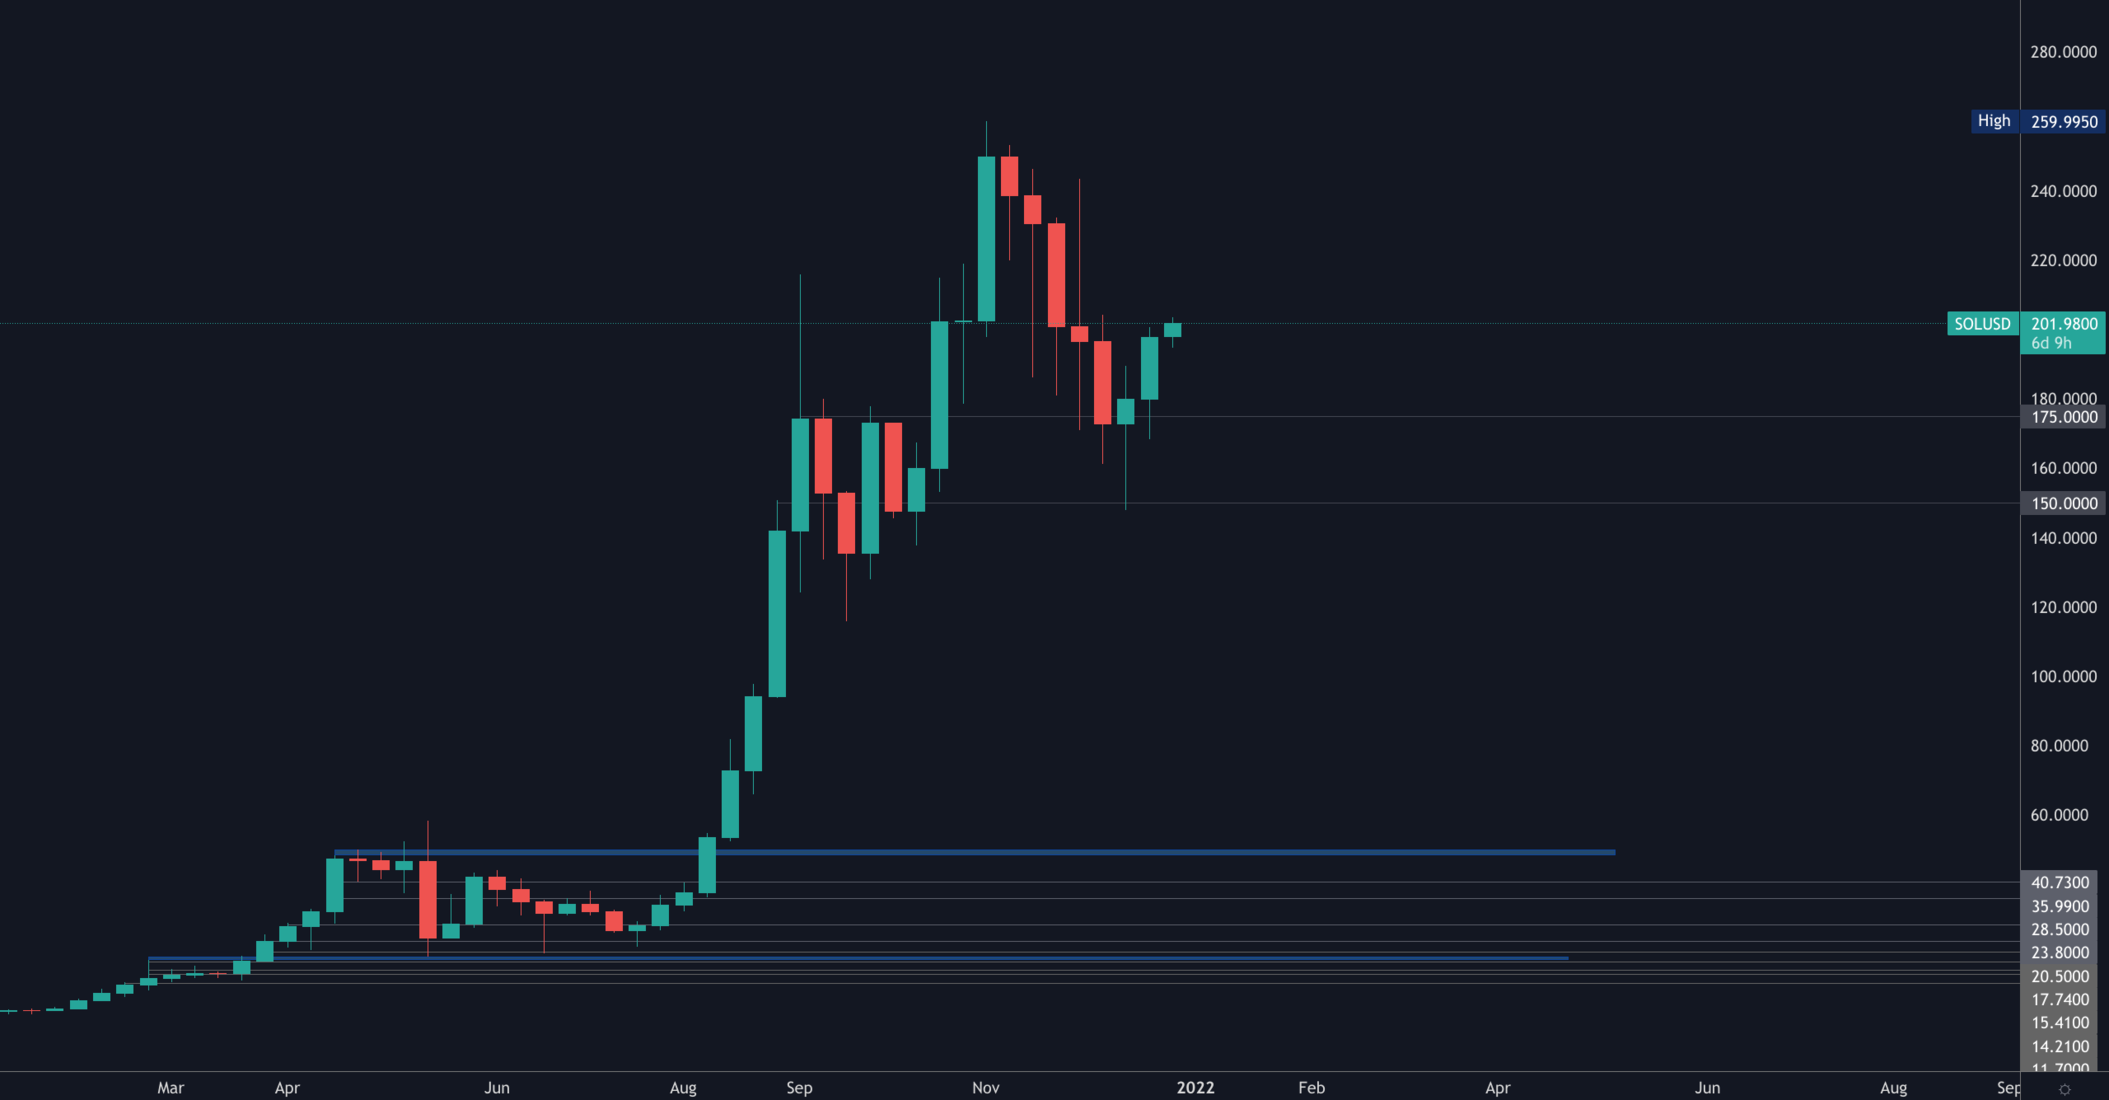
SOL reclaimed ground on the weekly timeframe and held $175 as support now it boils down to a daily candle closure above $200.
SRM
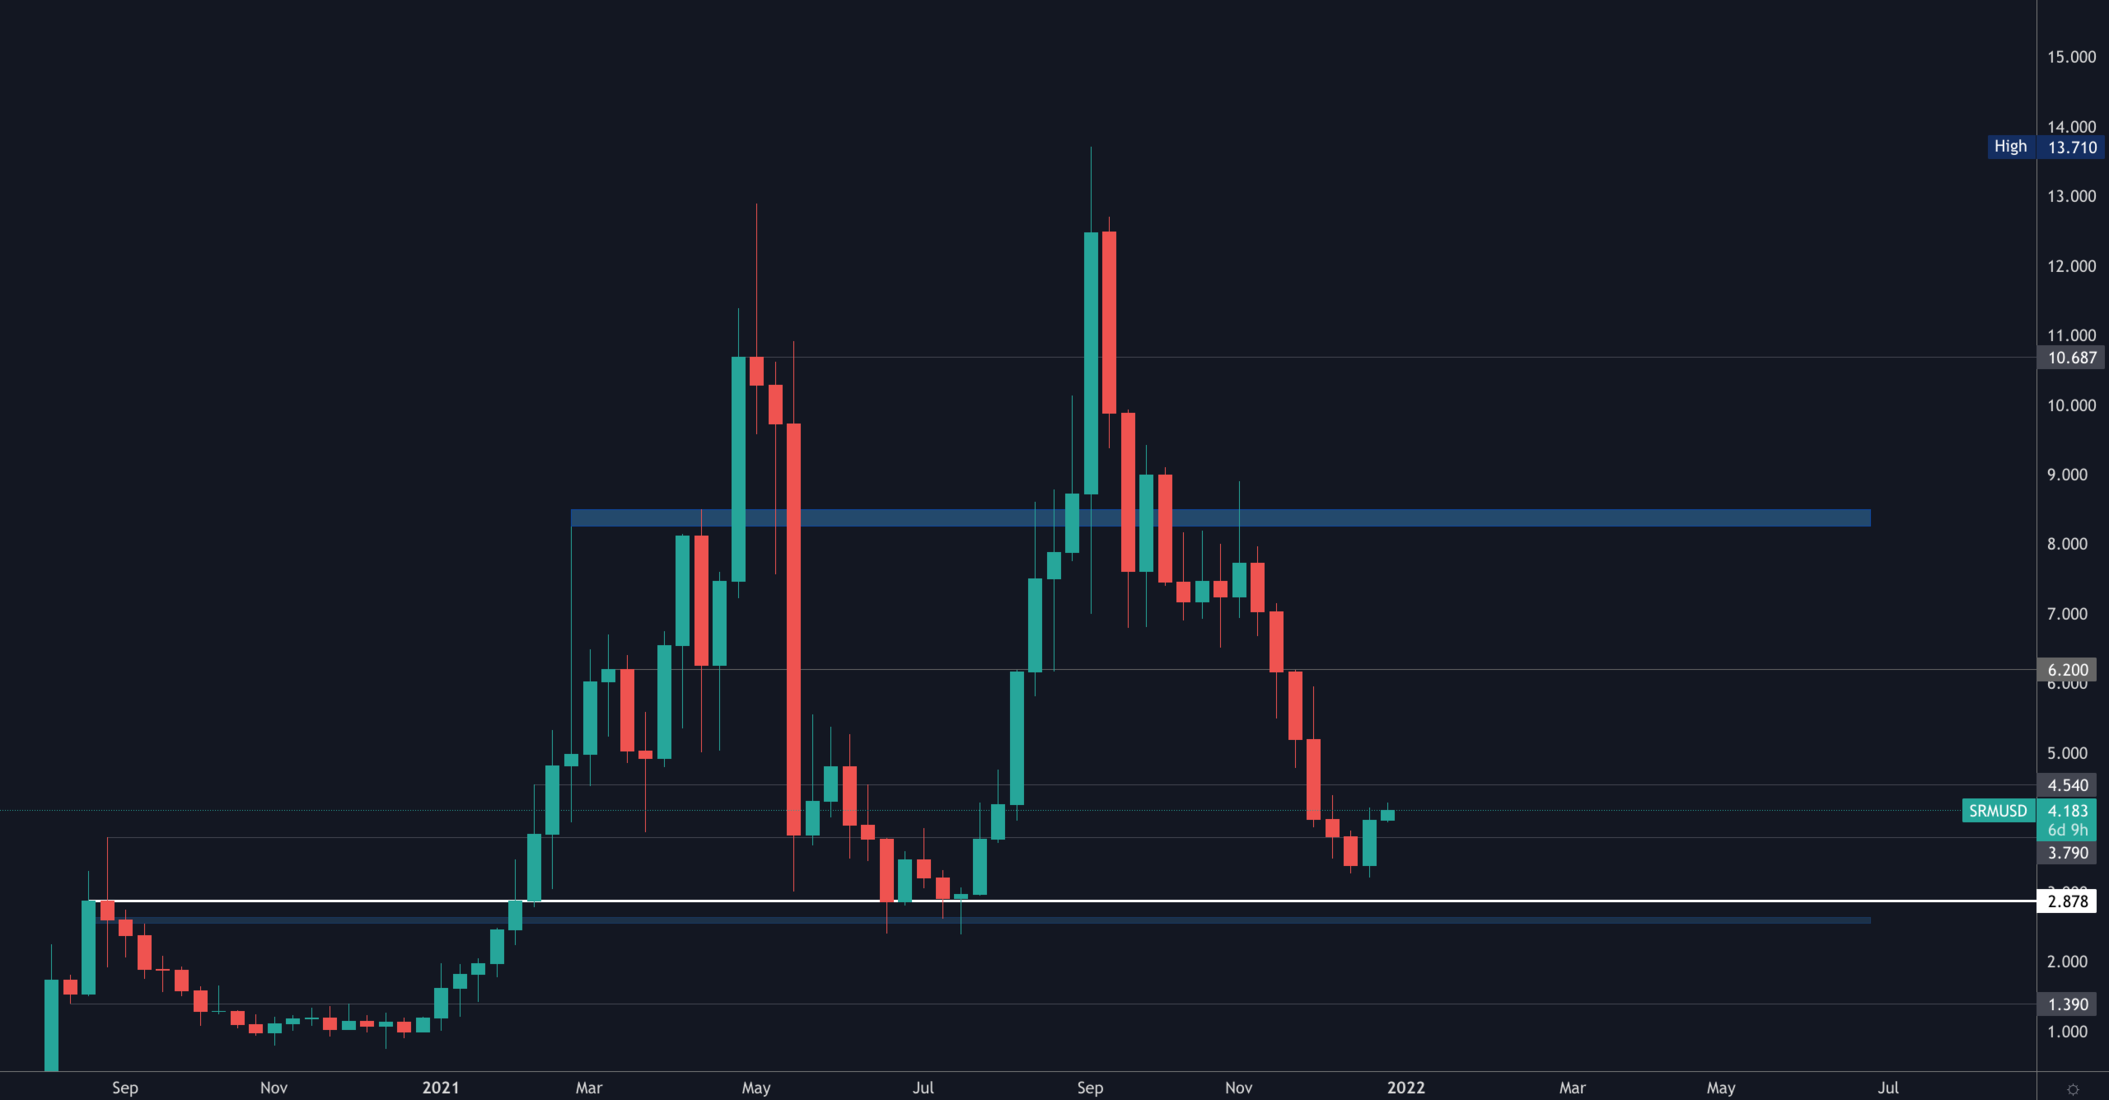
Same bias in regards to a bottom forming in the [$2.50-$4.00] range. Additionally, SRM registered a bullish engulfing candle on the weekly timeframe which has historically been a decent bottom indication in crypto (nothing is 100% certain in any financial market).
MINA
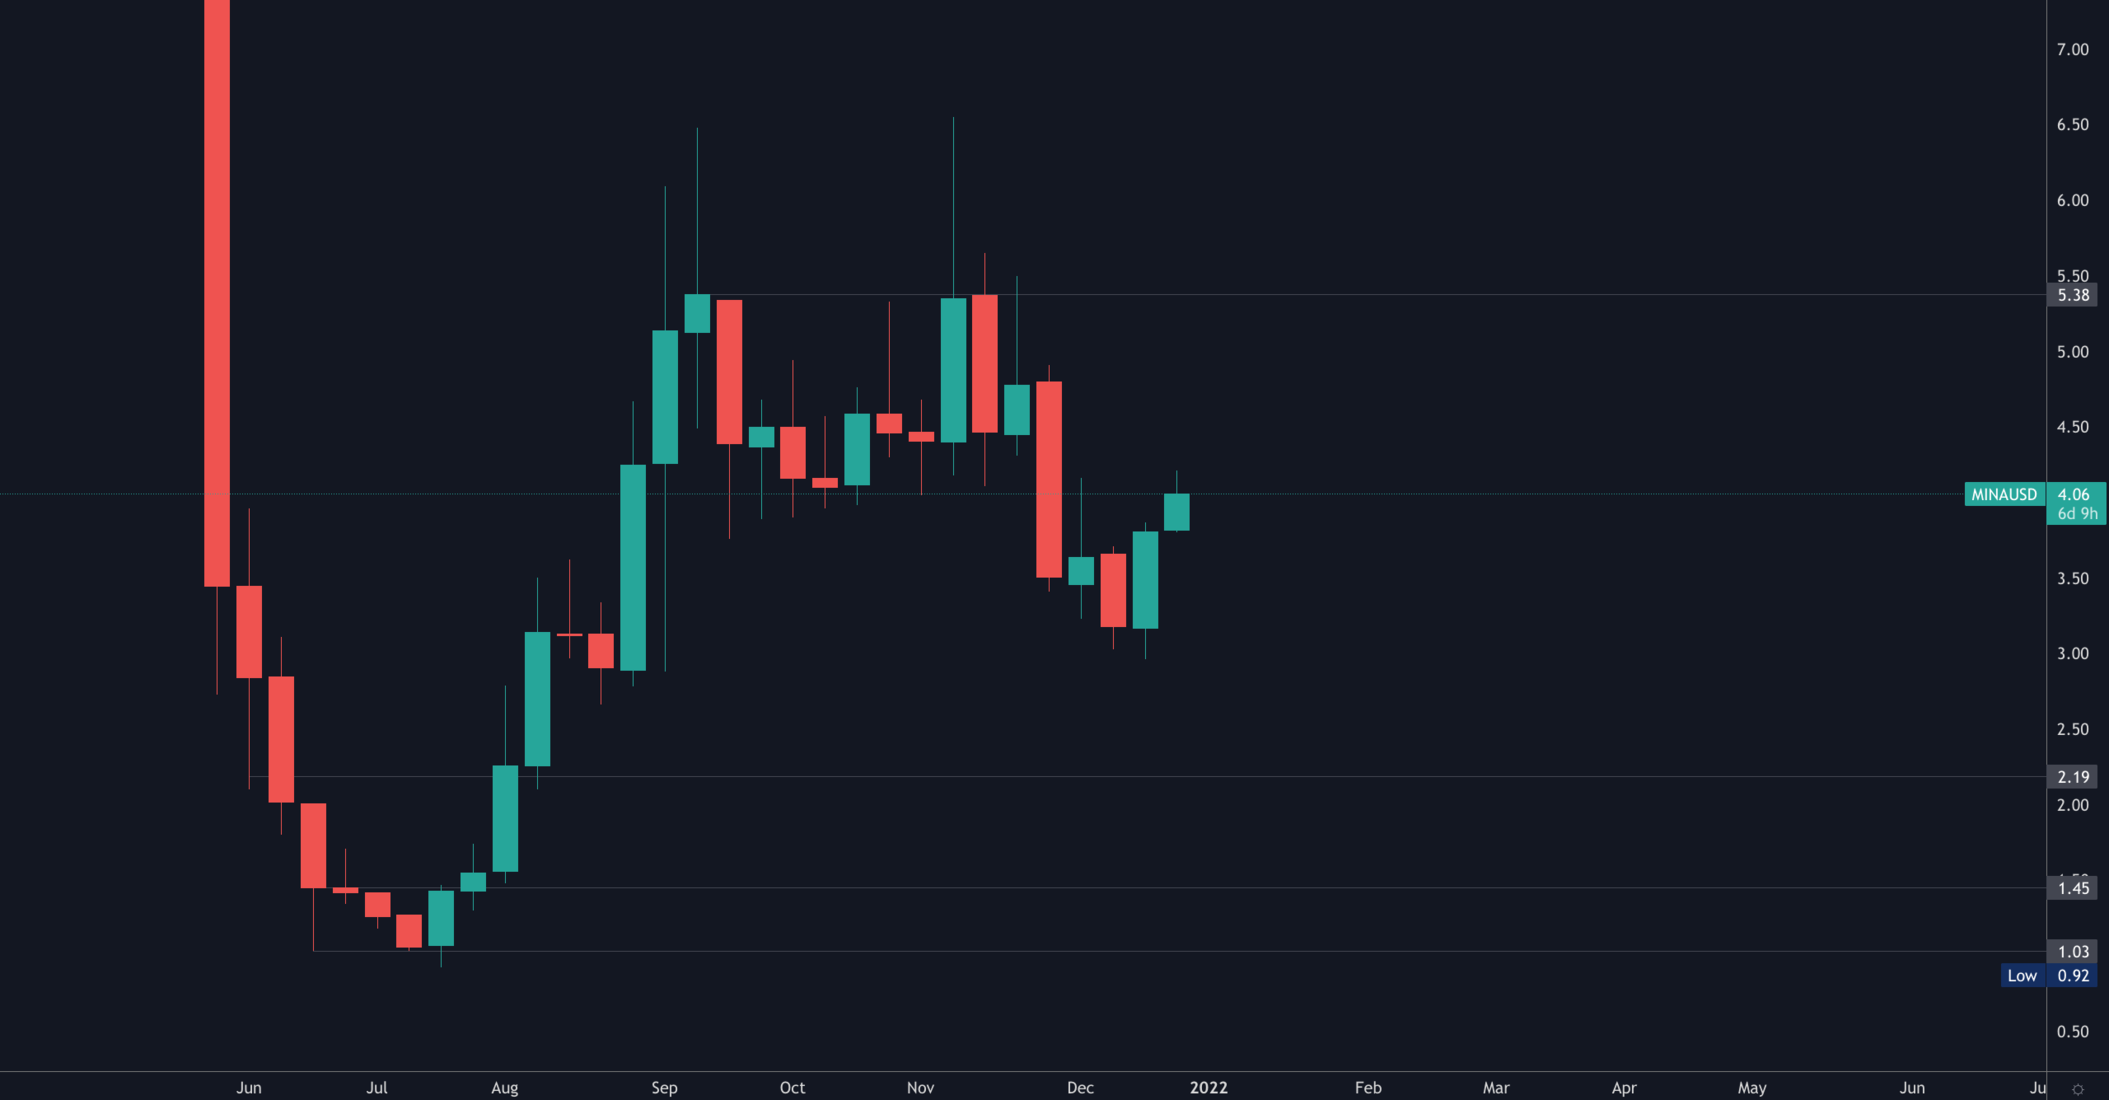
AND a bullish engulfing candle over here as well!
MINA's setting us for a test of its weekly resistance level at $5.40.
FTT
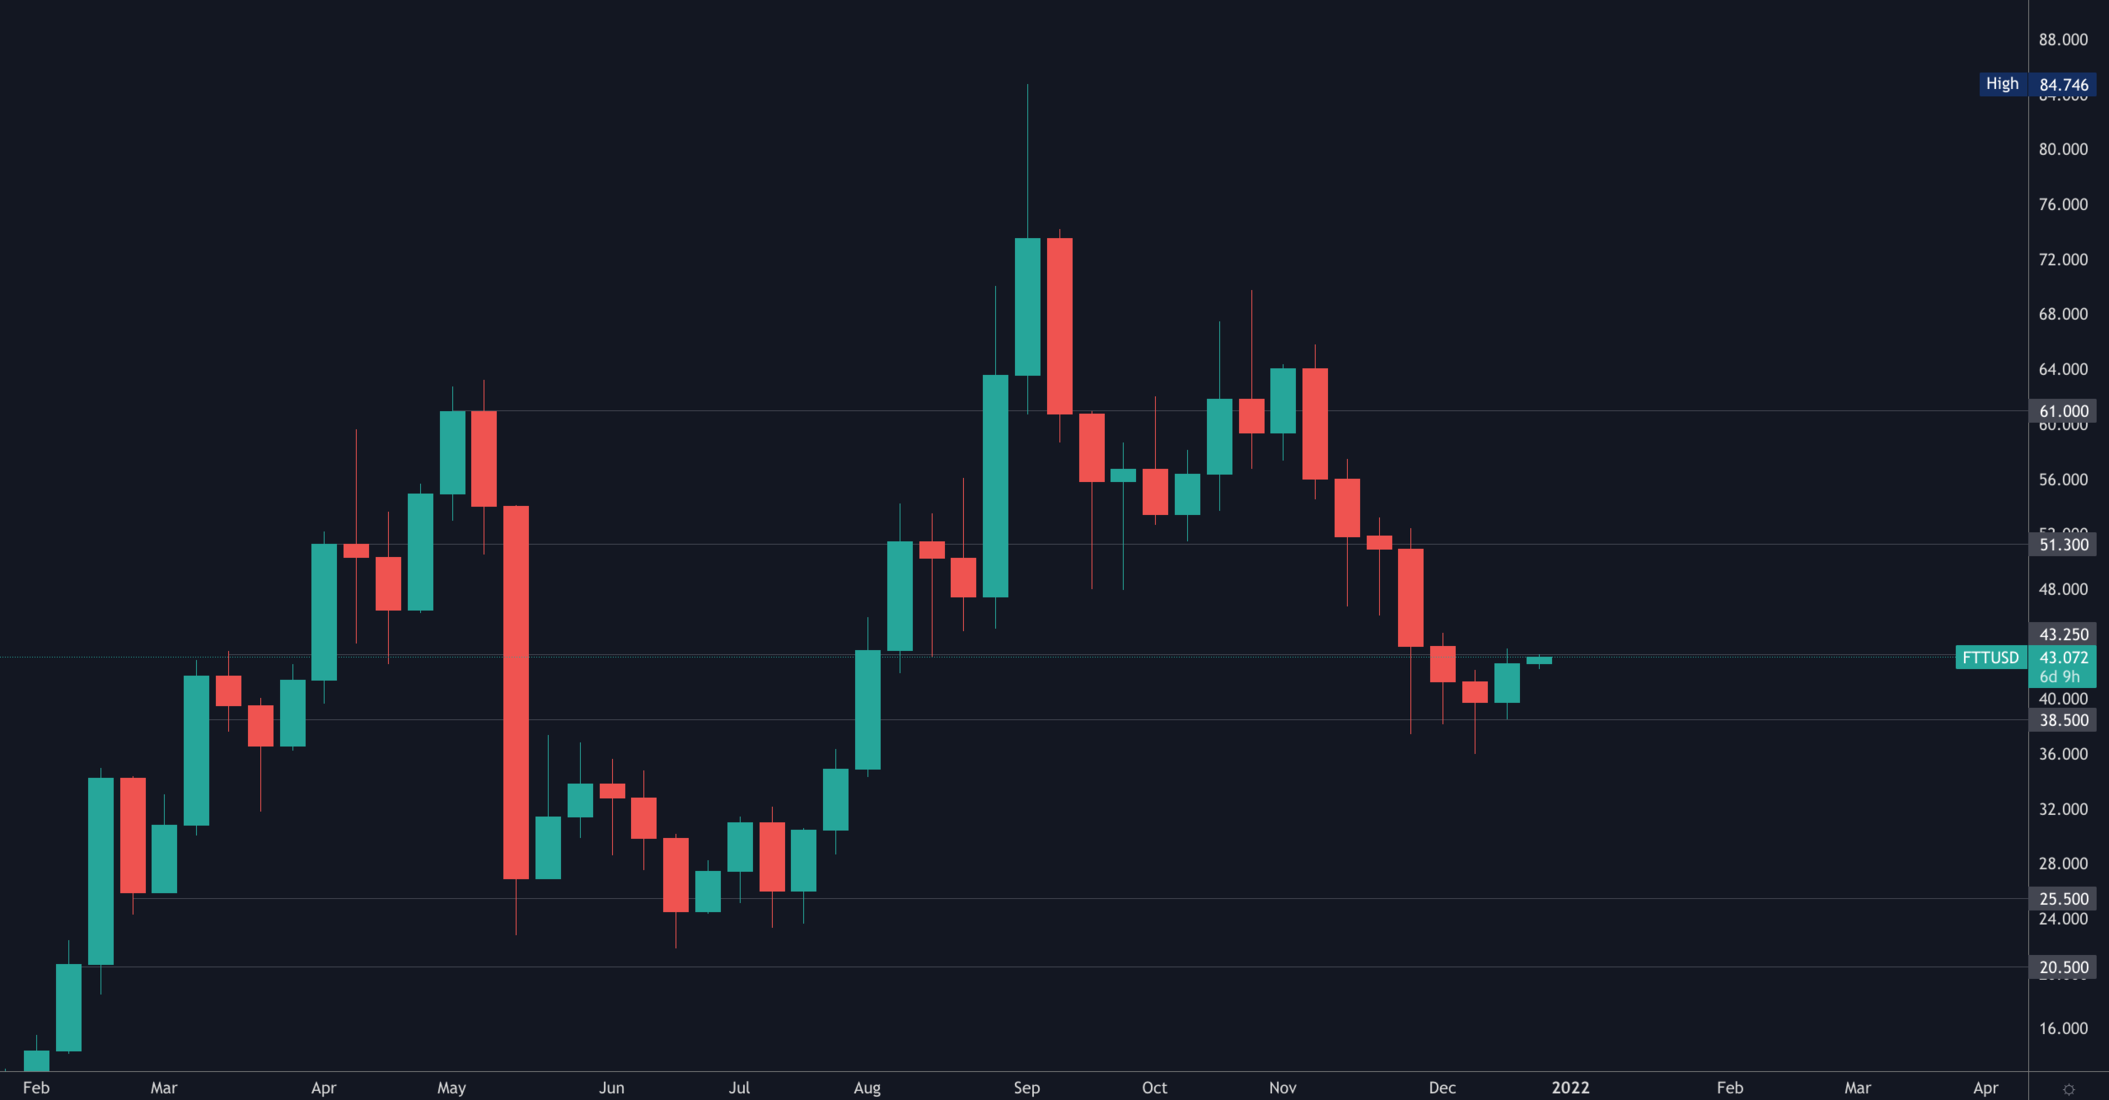
From a weekly perspective, as $38.50 held, $51.30 is up next on the cards for FTT (& yes there is a bullish engulfing candle here as well, albeit smaller).
DYDX
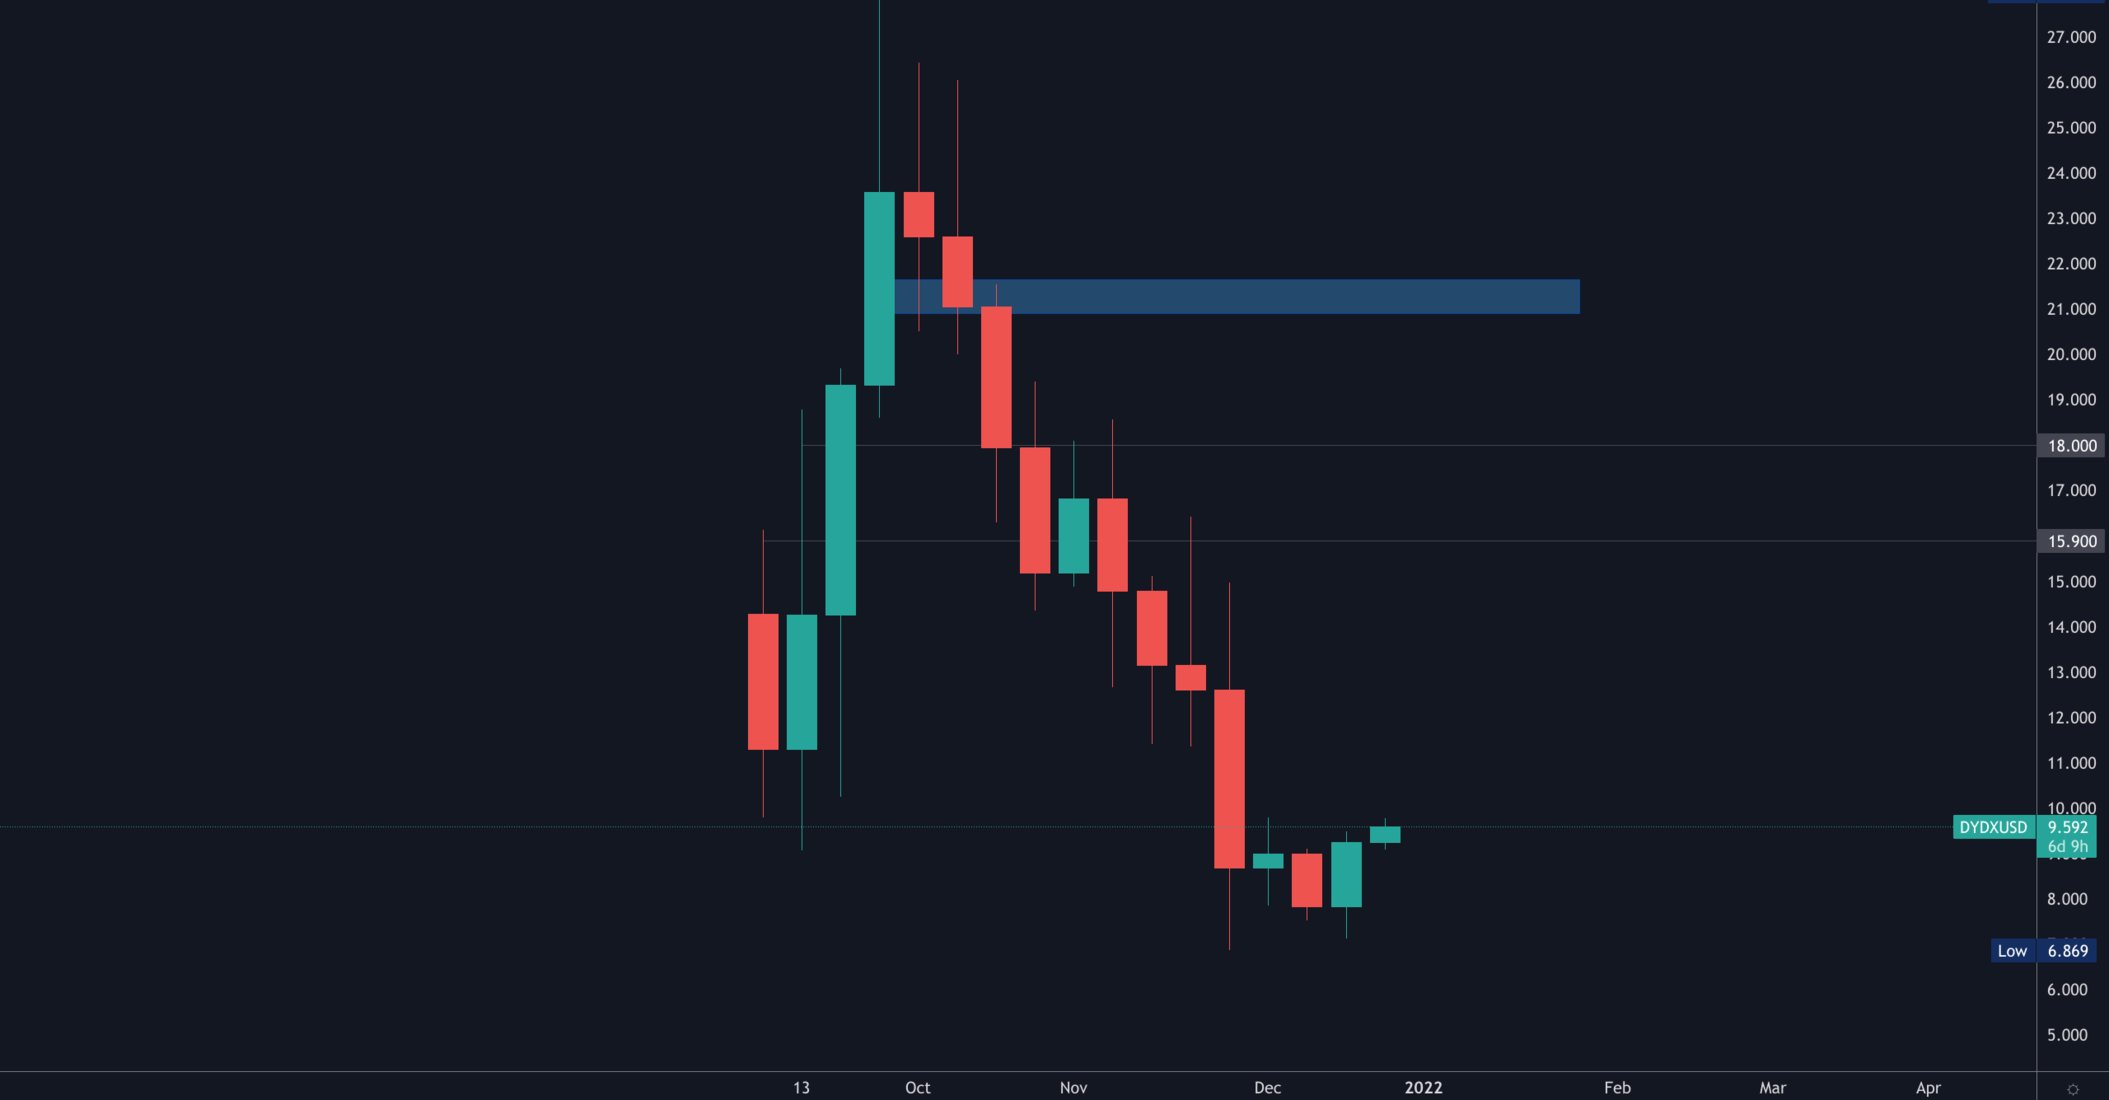
Bullish engulfing candle on the weekly timeframe but for DYDX to re-take the reigns, it must reclaim $10 on the daily timeframe first.
Disclaimer: Not financial nor investment advice. Only you are responsible for any capital-related decisions you make, and only you are accountable for the results.
Recommended from Cryptonary