Disclaimer: Not financial nor investment advice. You are responsible for any capital-related decisions you make, and only you are accountable for the results.
Macro
In just two days’ time (August 10th), the next Inflation numbers will be released. Expectations are that headline inflation may have peaked at 9.1% last month and that this month’s print may be down slightly to 8.7%. However, Core Inflation (which excludes volatile food and fuel costs) is expected to be up from 5.9% last month to 6.1% this month. The reason for this is due to rising rents and wages which are two elements that are believed to be much more difficult to bring down (“sticky”).Last week, the Jobs data that came in were much stronger than anticipated. The Unemployment Rate fell from 3.6% to 3.5% whilst Non-Farm Payrolls (Jobs added) came in at 528k, up from 398k the prior month and beating forecasts by 240k (forecast was 290k). A strong labour market may indicate to the FED that they may have to continue their aggressive stance in raising rates as demand destruction isn’t showing up in the labour market currently. This strong Jobs data may also re-align the markets back to the inflation narrative, rather than growth which is what it has been for the past few weeks, and see this idea of a ‘soft pivot’ from Powell and the FED as nothing more than just fantasy.
All-in-all, this week's inflation data will be vital for markets and they will likely react aggressively to it. Numbers greater than expected may shock the markets and send them lower, smaller numbers than expected may help to add fuel to the current relief rally that we’re seeing.
TLDR
- In the past few weeks, there has been a significant spike up in selling from some of the older coin cohorts, not something we want to be seeing in terms of confidence and strong conviction going forward.
- The Net Realised Profit/Loss shows investors don’t have the confidence to hold their coins and wait for higher prices before they sell at a profit.
- This week's inflation data will be vital for markets and they will likely react aggressively to it (August 10th).
- Bitcoin managed to reclaim $23,000 on the weekly timeframe - $26,000 is now on the cards.
Total Market Cap
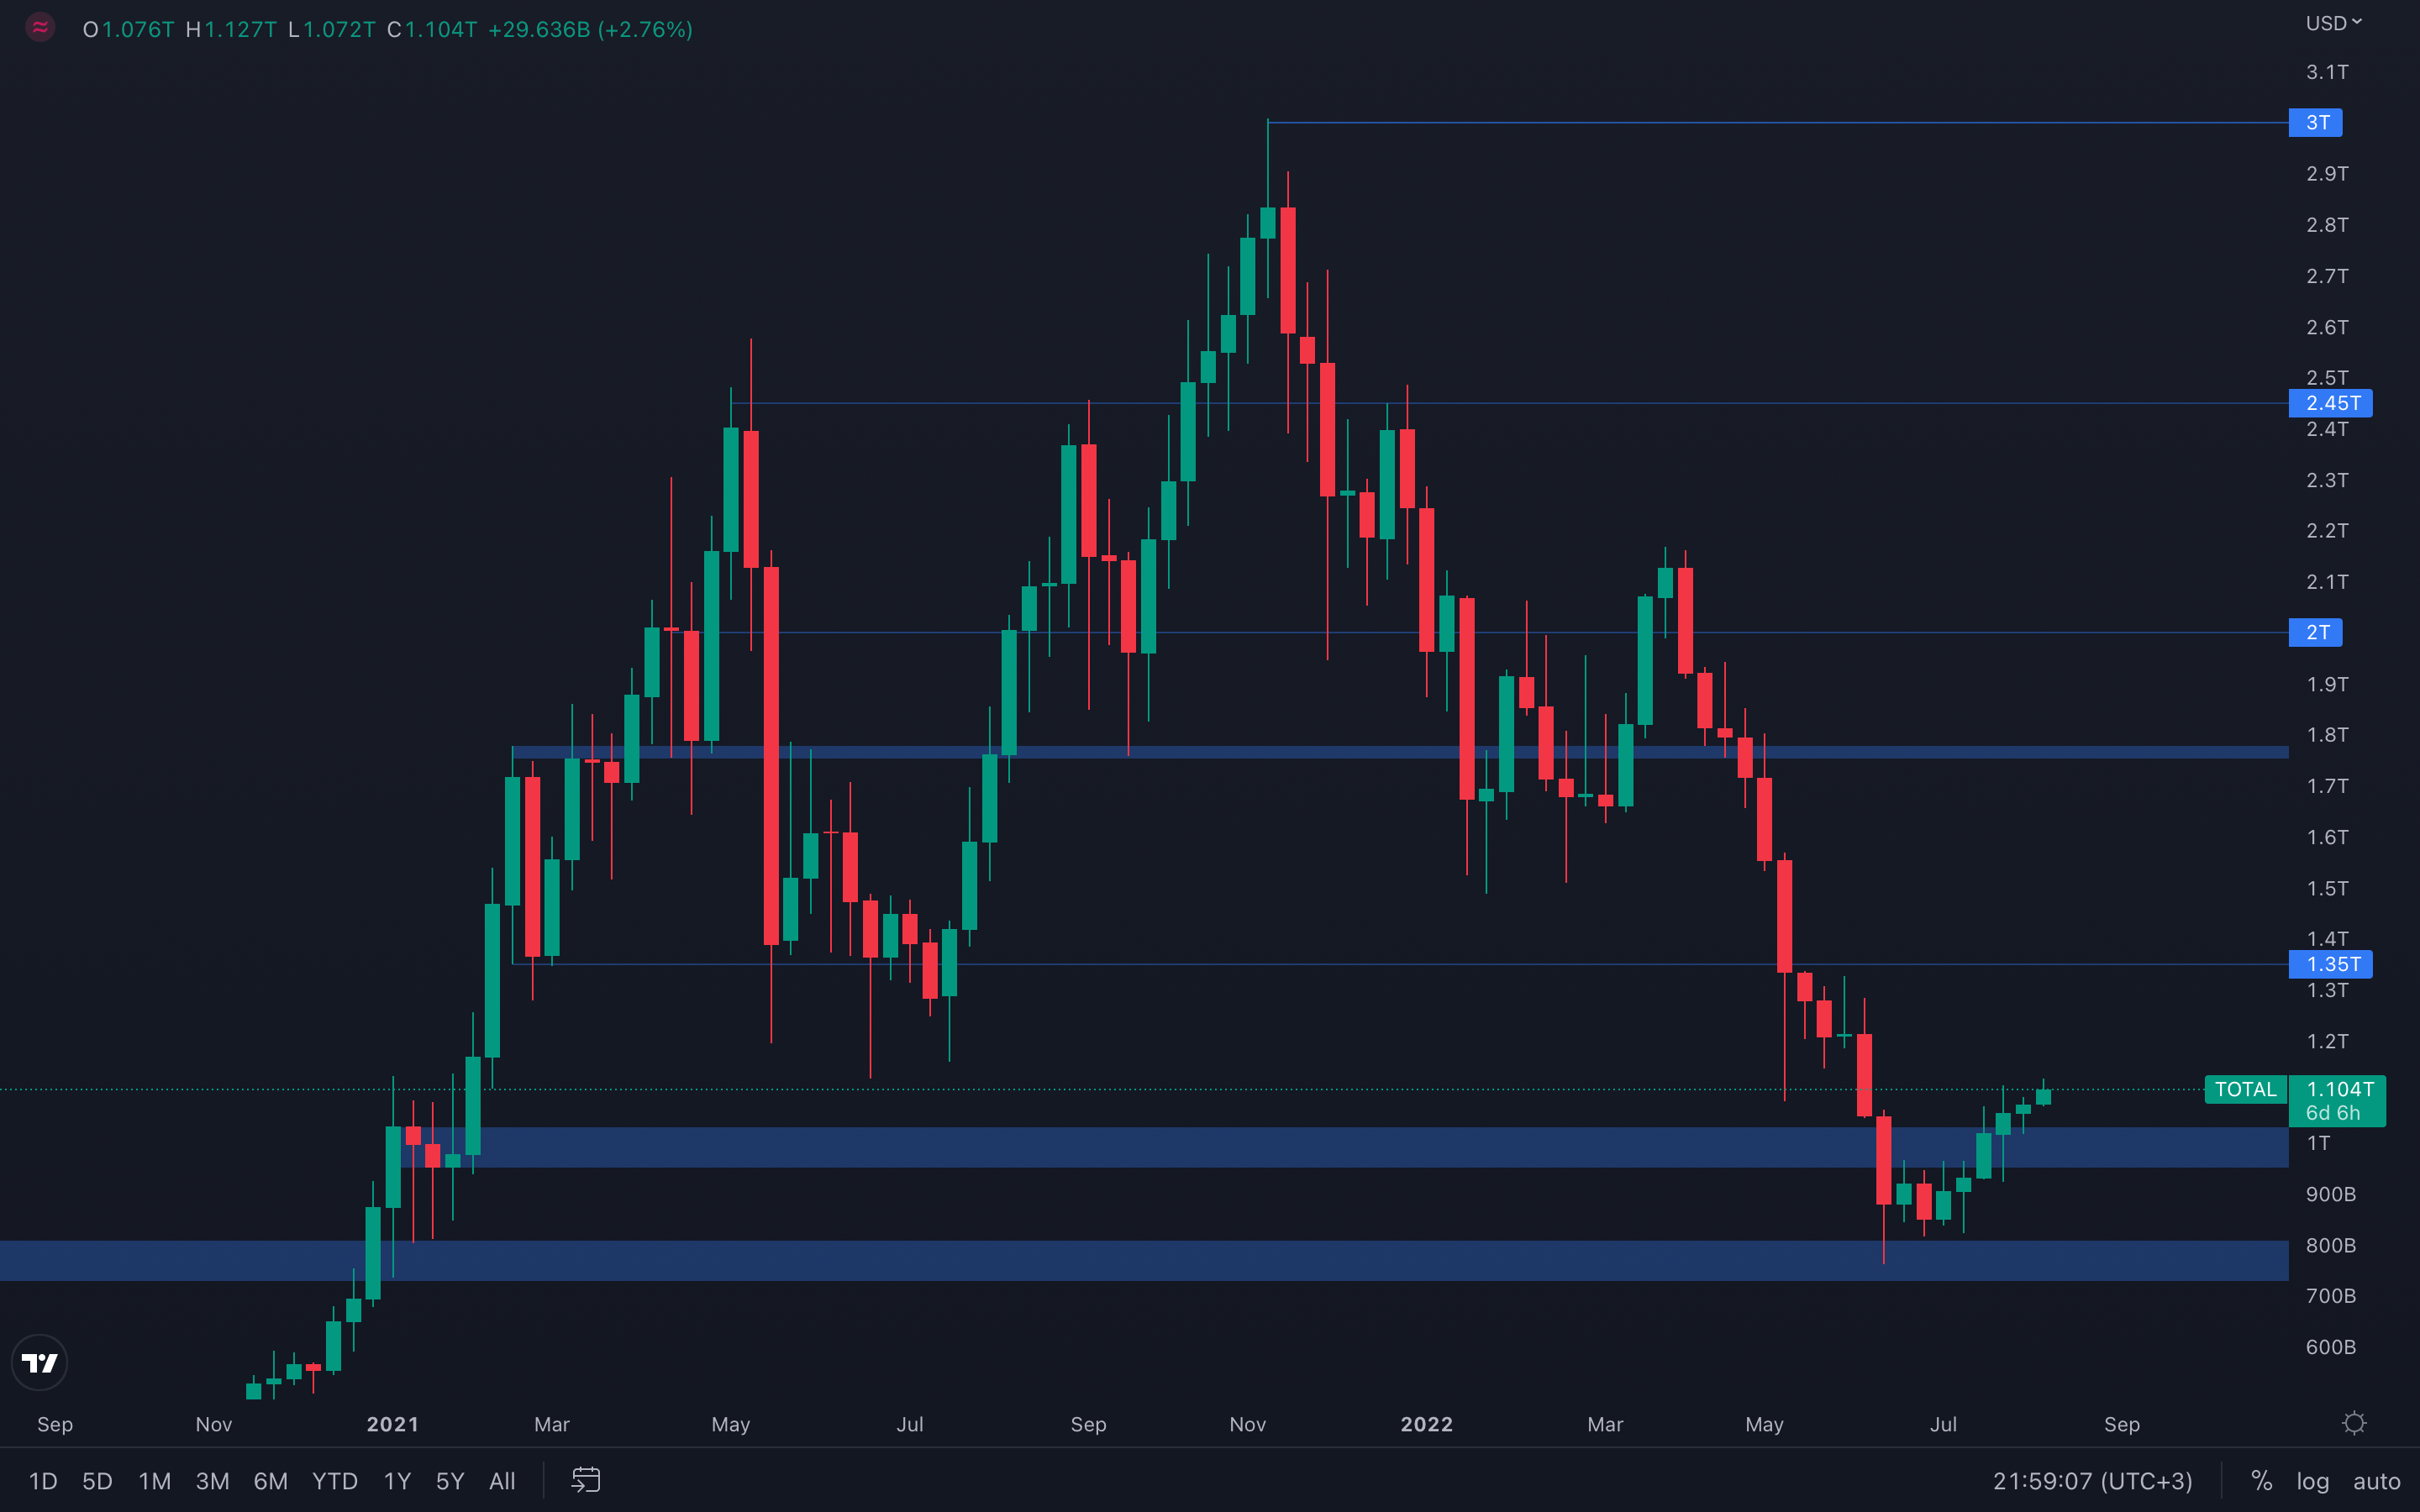 The Total Market Cap is still showing strength after reclaming its $1T psychological and technical level and remains on a path towards $1.35T. However, a proper retest of this level might still be on the cards, and only a $1T weekly loss will suggest if the Total Market Cap will start to descend or continue to rise from here.
Altcoins Market Cap
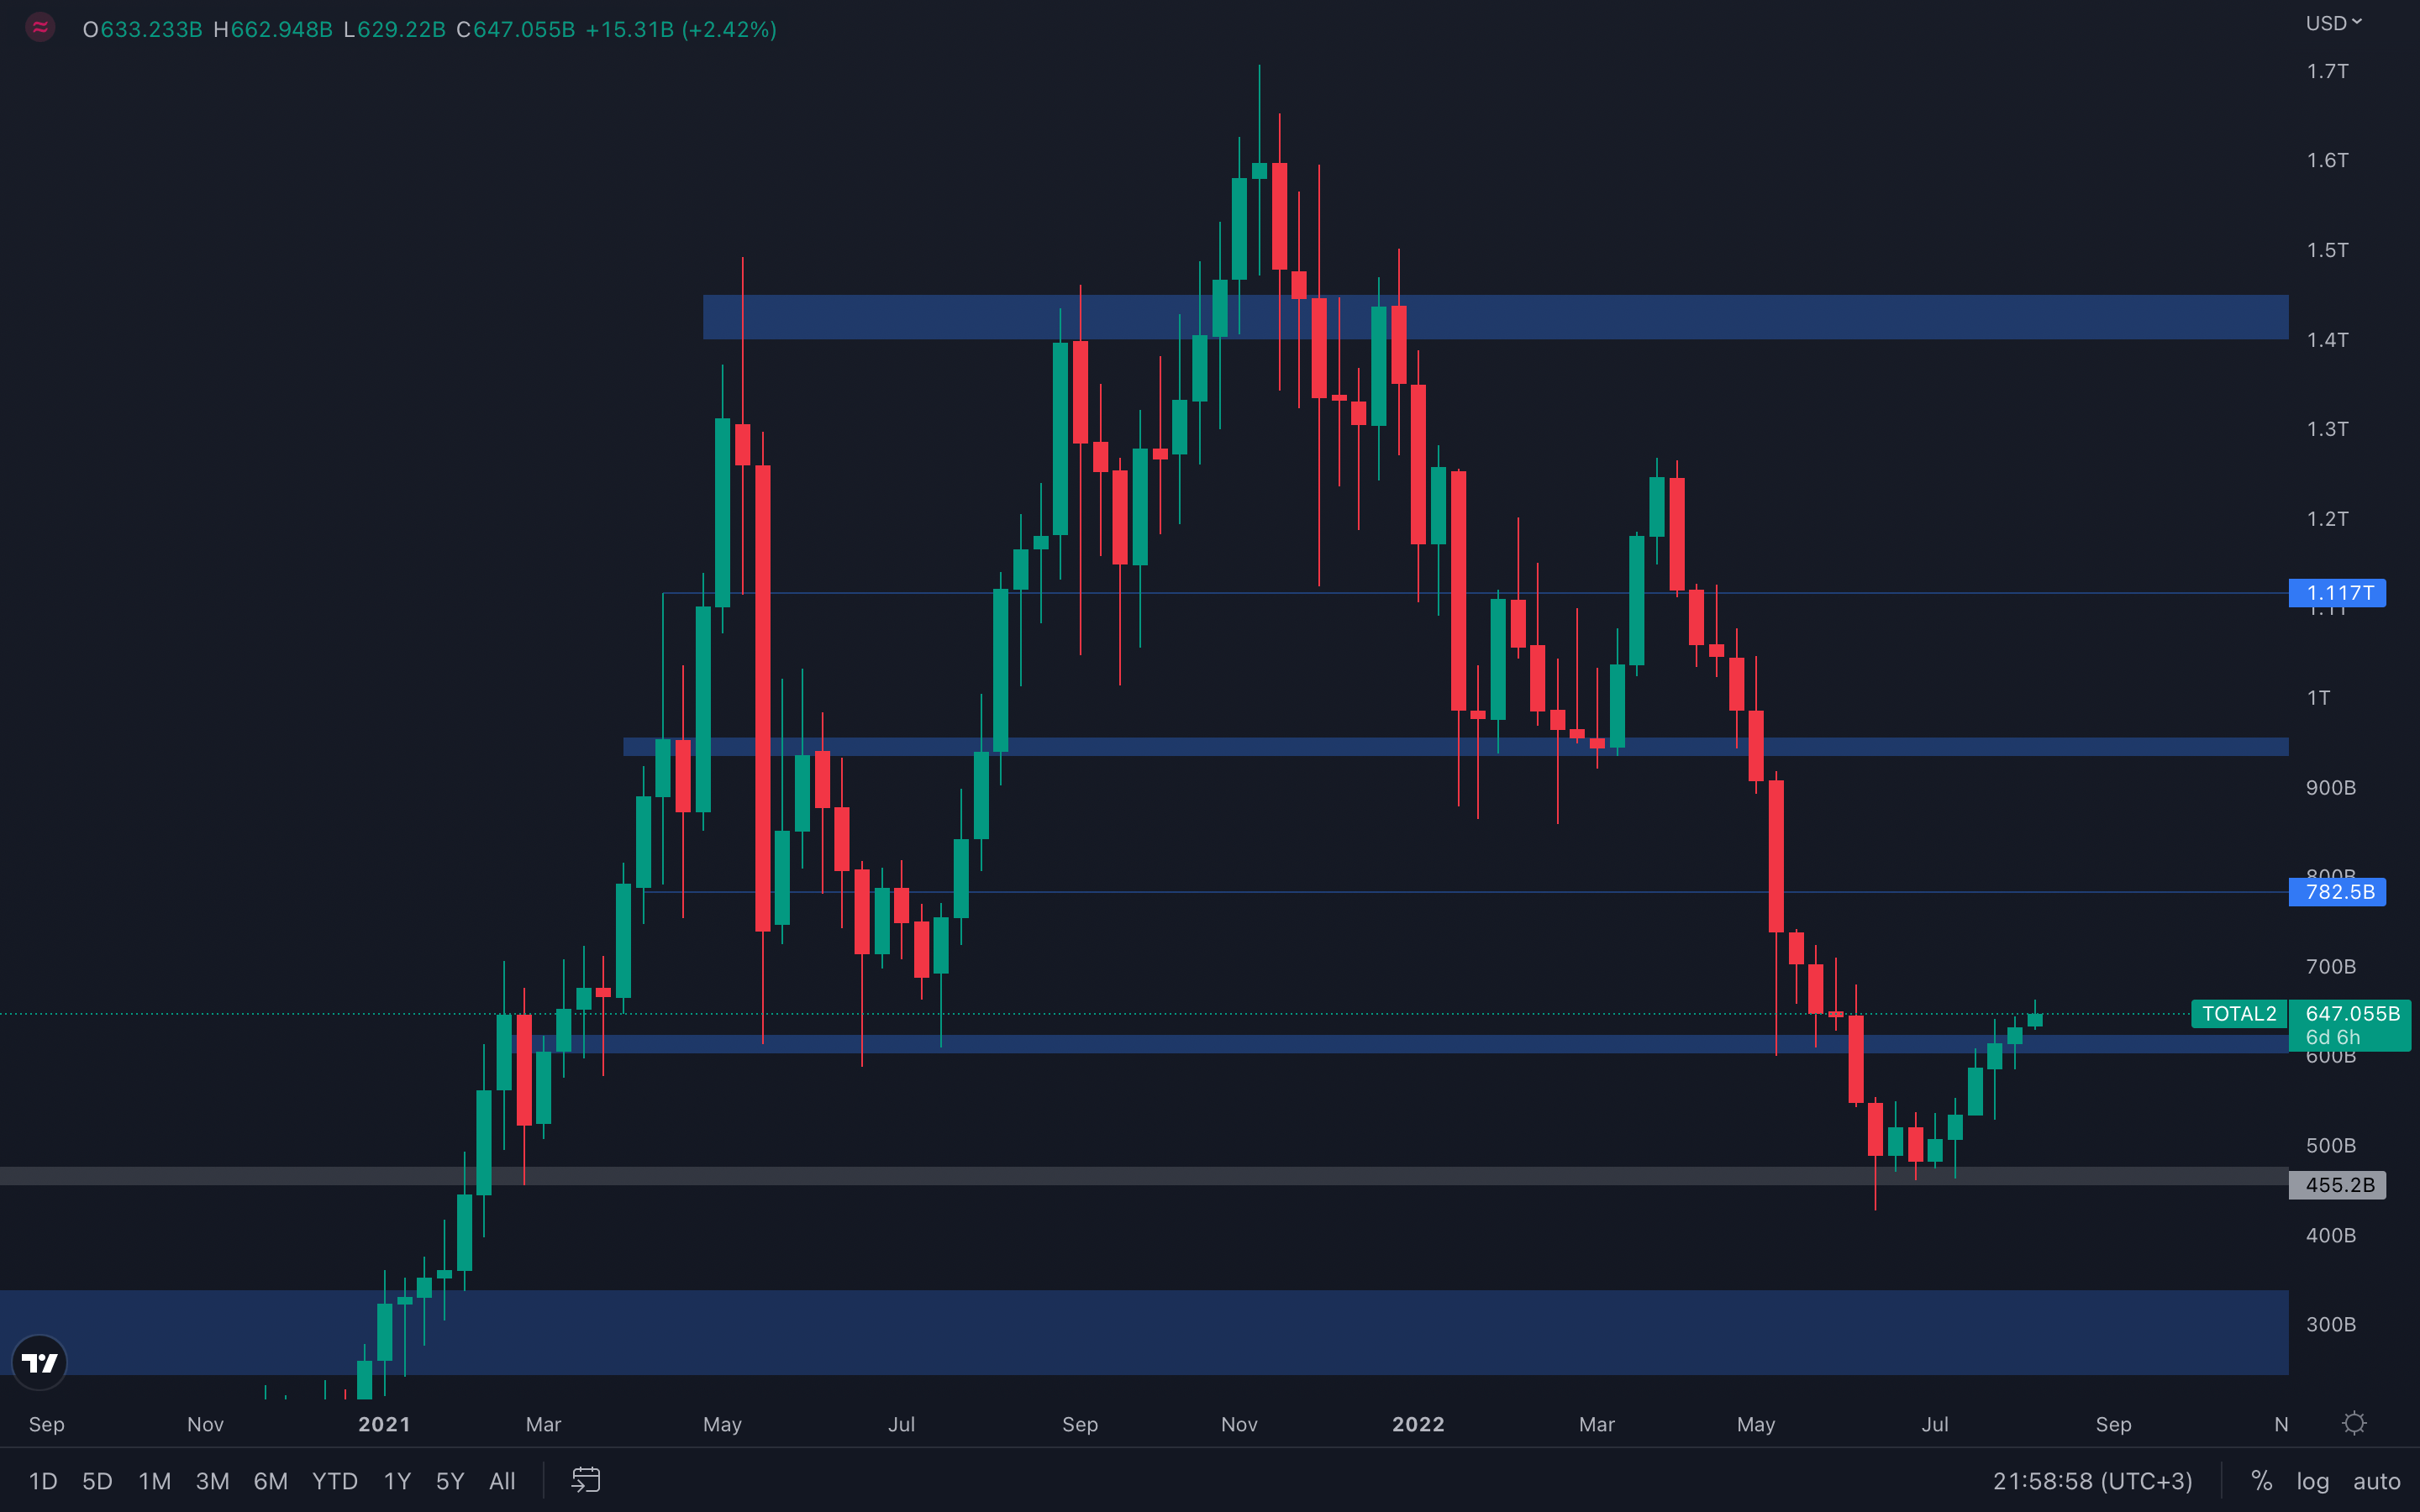 The Altcoins Market Cap has found itself in a similar situation with the Total Market Cap - after reclaiming its $600B level, flipping it from resistance into support, the index is still showing strength despite the lack of a proper weekly retest at said level. We believe retests are essential in confirming further movements towards a specific direction, and not experiencing a retest might not suggest much confidence.
The picture remains clear, even with the above - unless The Altcoins Market Cap loses its $600B support level via a weekly closure under, then $782.5B remains on the cards.
Bitcoin - Technical & On-Chain Analysis
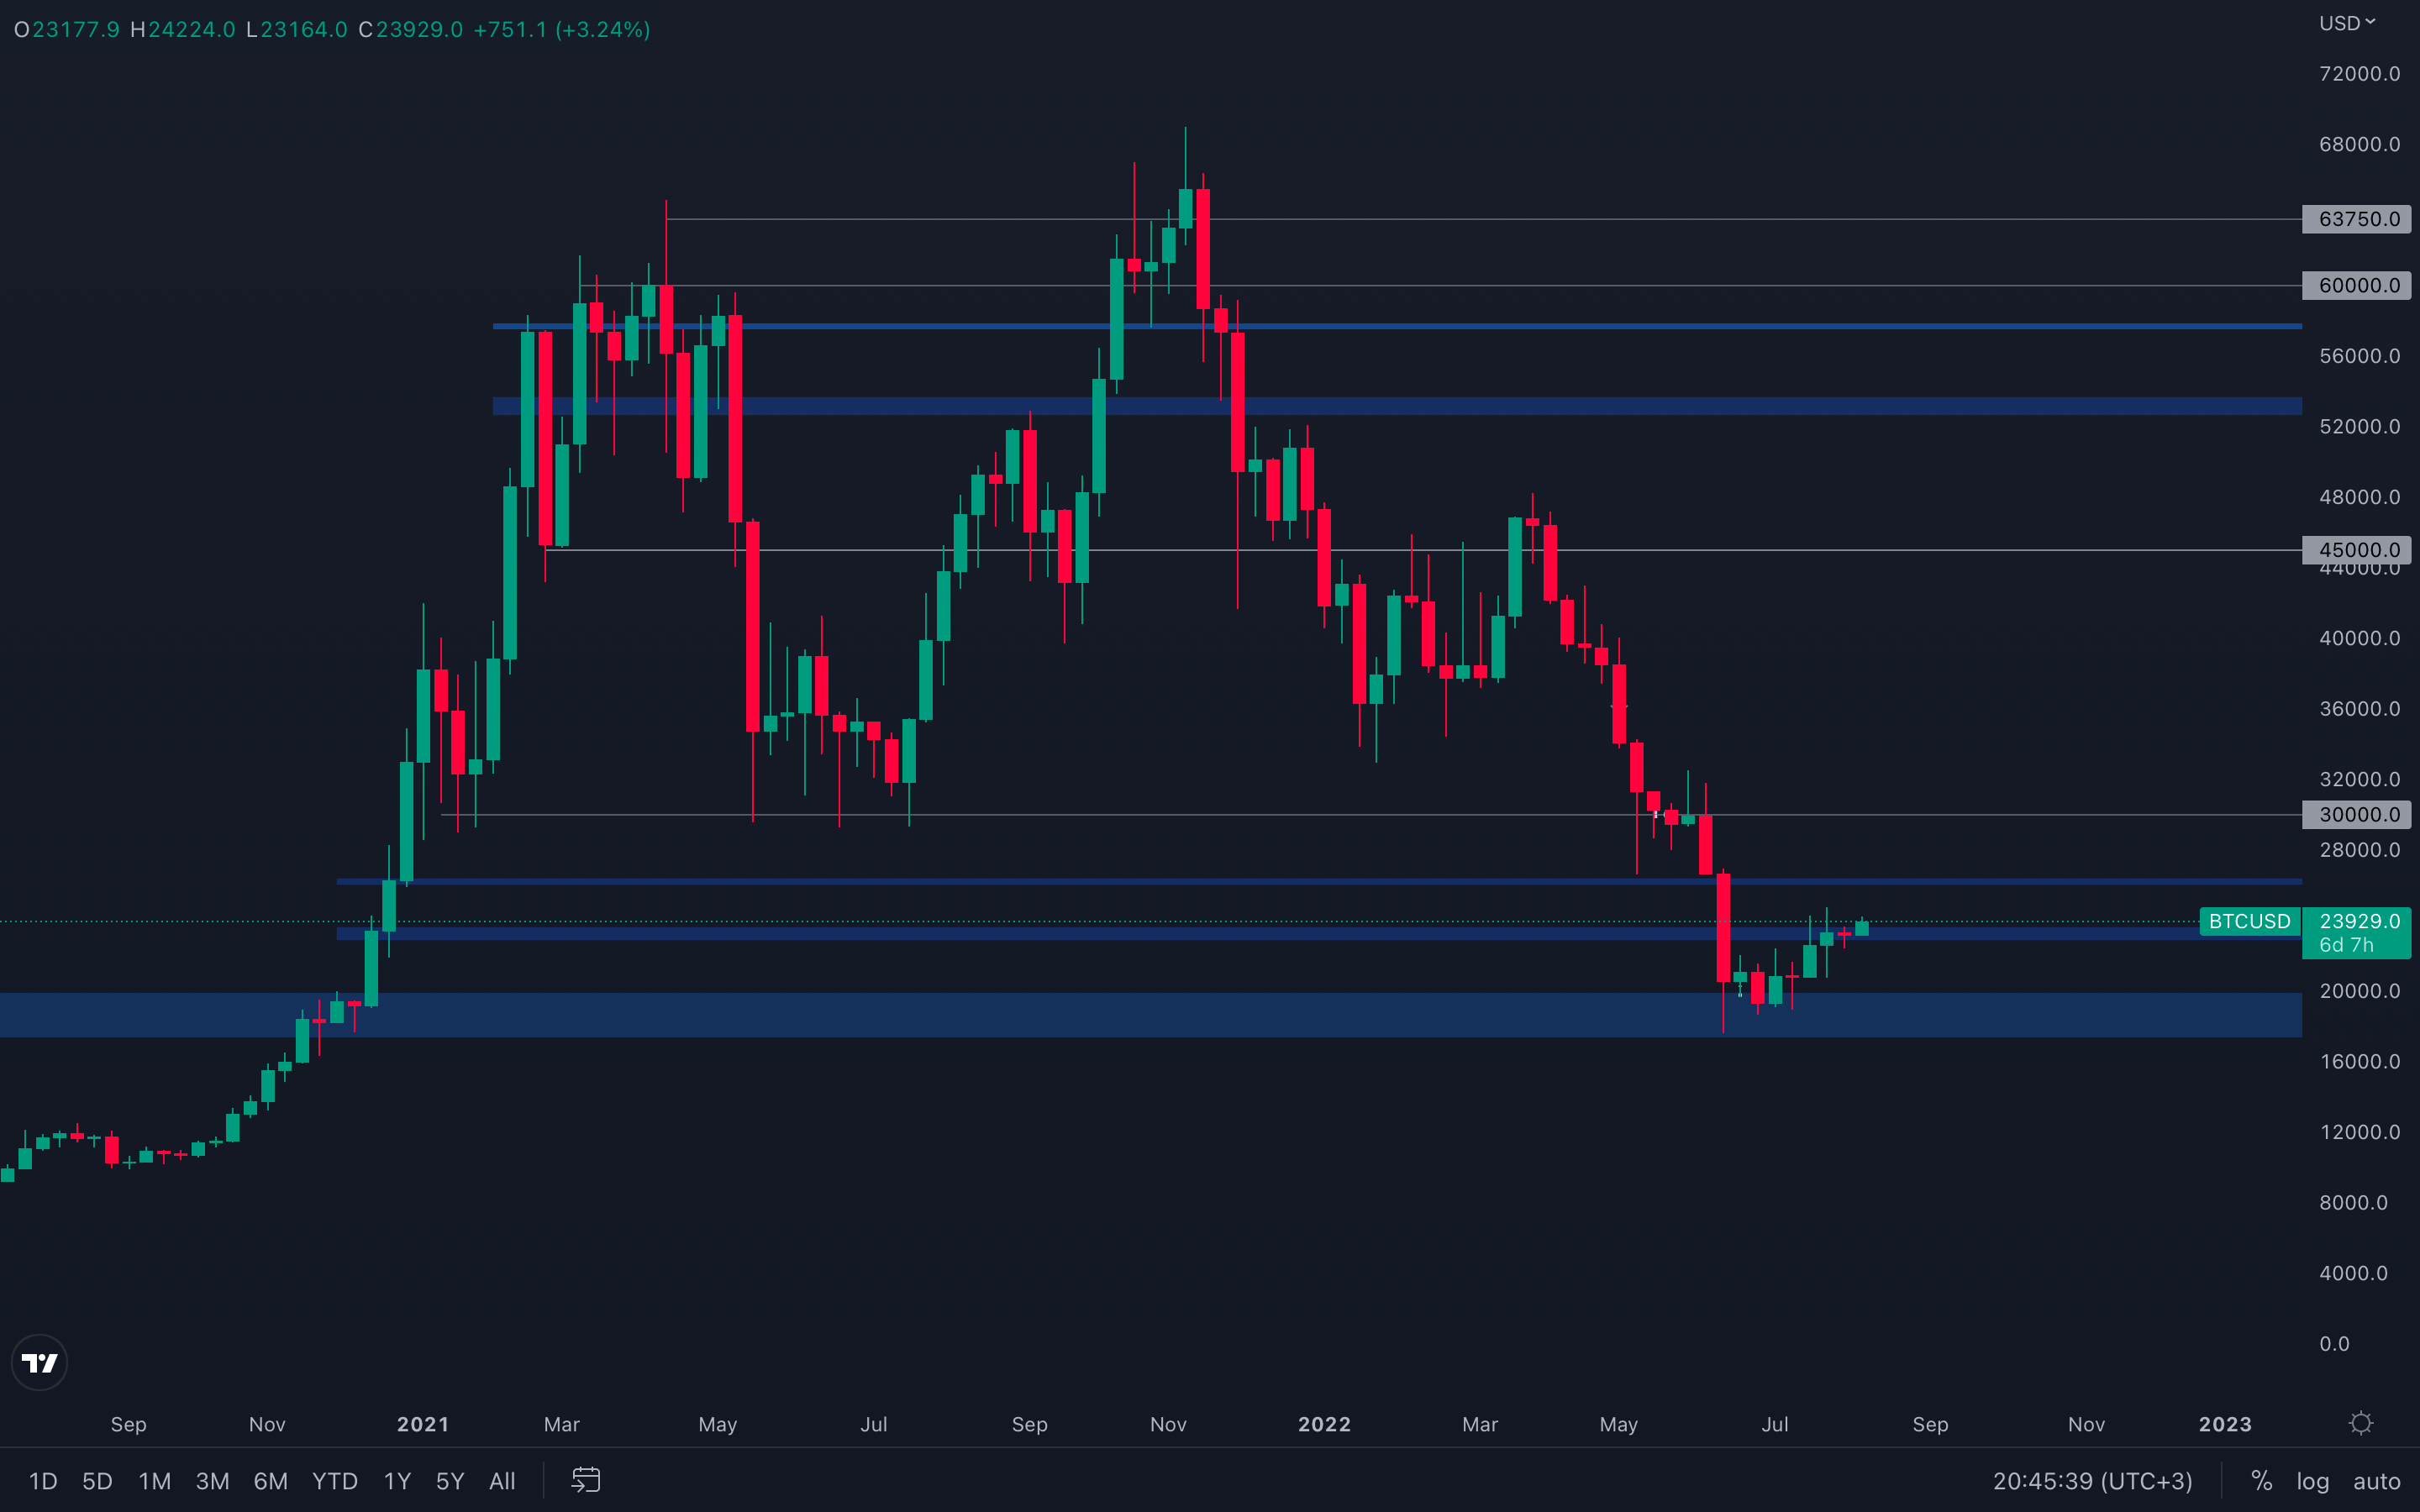 Bitcoin continues to beautifully trade in a daily bullish market structure and has reclaimed the $23,000 - $23,500 resistance area on the weekly timeframe, flipping it into support. This finally puts $26,000 on the horizon, a level we've been expecting for some time. However, further upside, higher than $26,000 is debatable - we have no significant volume to back a move towards $30,000, no positive changes on the macro side, and most importantly, no real conviction from high market participants. Even if we are confident Bitcoin will reach $26,000, this rally should still remain a bear market rally, with no actual strength throughout the entire move. Any moves higher than $26,000 become extremely risky, and caution must be advised, as always.
Metric 1 – Addresses (Overview)
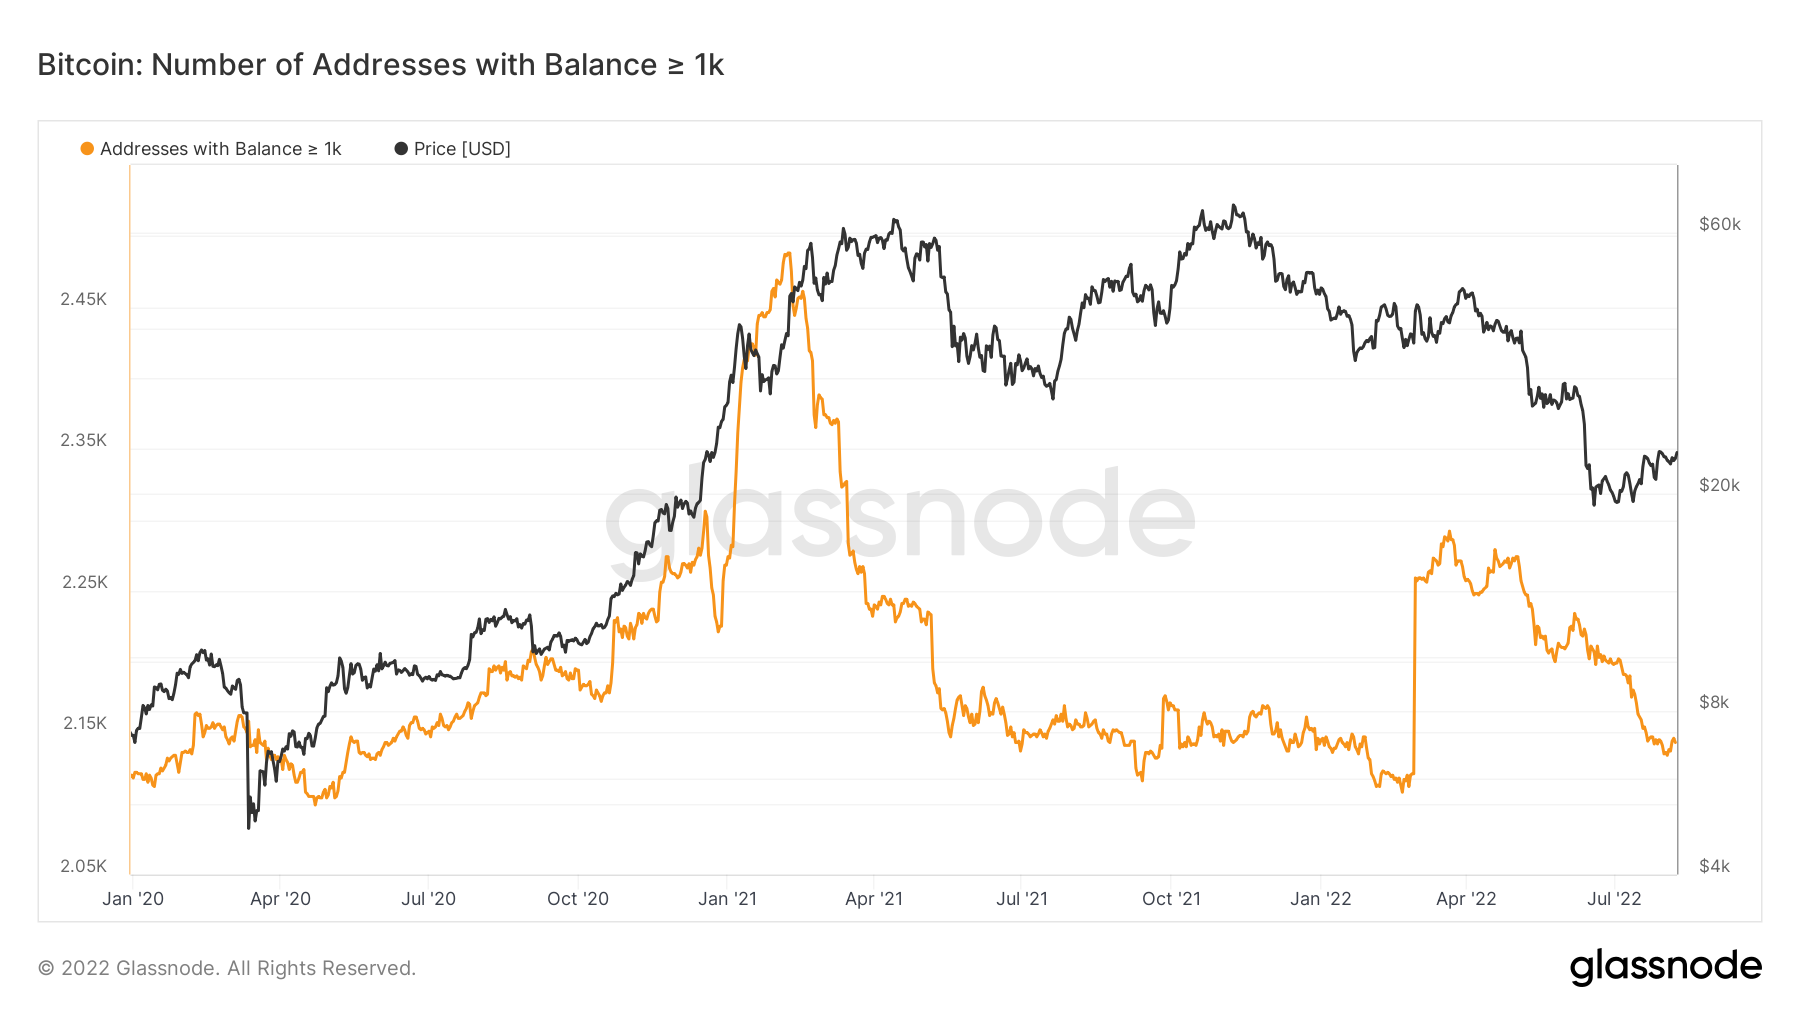
On most weeks we cover the Addresses metric, simply due to it being one of our best indicators. The cohort we look to is the ‘Addresses with Balance > 1,000 Bitcoin’ as historically, they are best at timing when to risk-off (sell Bitcoins) and risk-on (when to buy Bitcoins). This metric is still showing that it’s risking off but in the last week, they have added Bitcoin, but only very minimally. The chances are that this is likely just some fomo’ing in during this rally, however, this is something we should keep tracking over the following weeks, as if it were to spike up much further, we would have to re-consider what is going on here.
Bitcoin – Addresses with Balance > 1,000 Bitcoin
 Metric 2 – Coin Days Destroyed
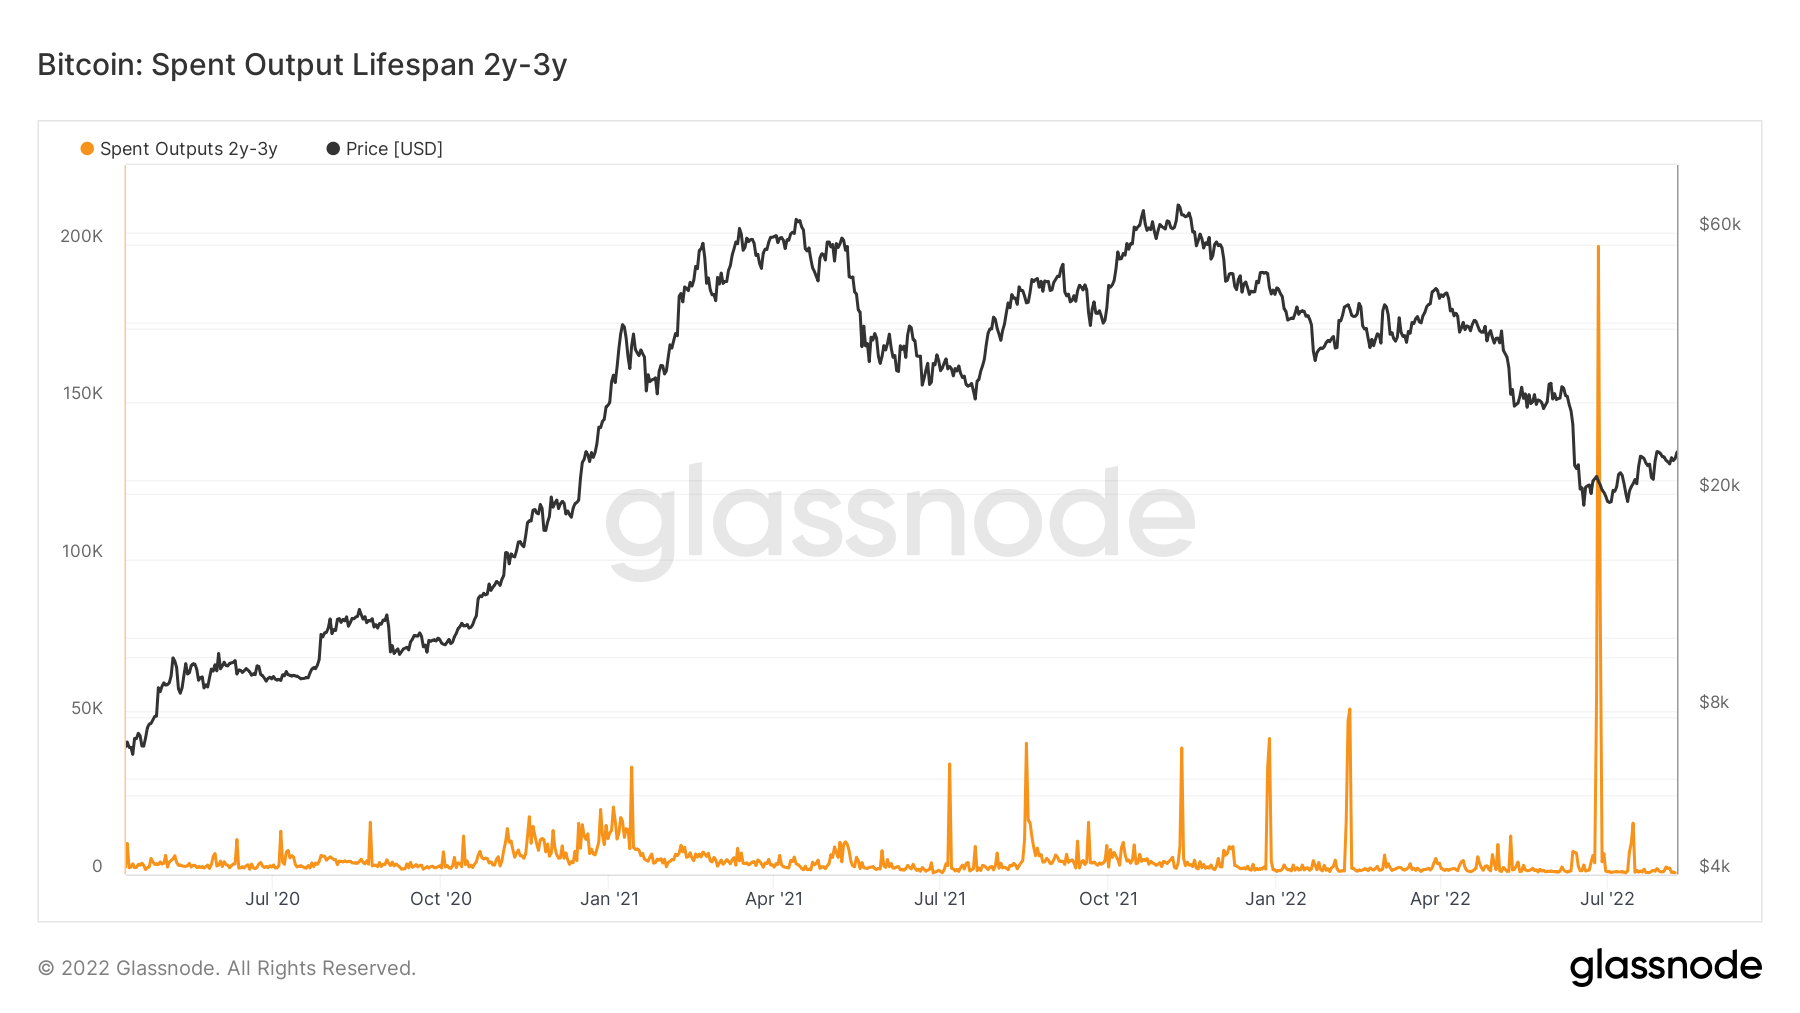
Another key metric we look to is the Coin Days Destroyed metric. This tells us what cohort (split up into coin ages) of coins have been selling and which one’s haven’t. This way, we can identify who are the sellers behind price collapses and when the historically more profitable cohorts are selling, perhaps that is a time that we should consider doing the same. In the past, we have looked to the older coins cohort as they have been the most profitable overall. Currently, we’re seeing normal selling pressures from younger coins. However, in the past few weeks, there has been a significant spike up in selling from some of the older coin cohorts - not something we want to be seeing in terms of confidence and strong conviction going forward.
Bitcoin – Spent Outputs 1Y – 2Y

Bitcoin – Spent Outputs 2Y – 3Y
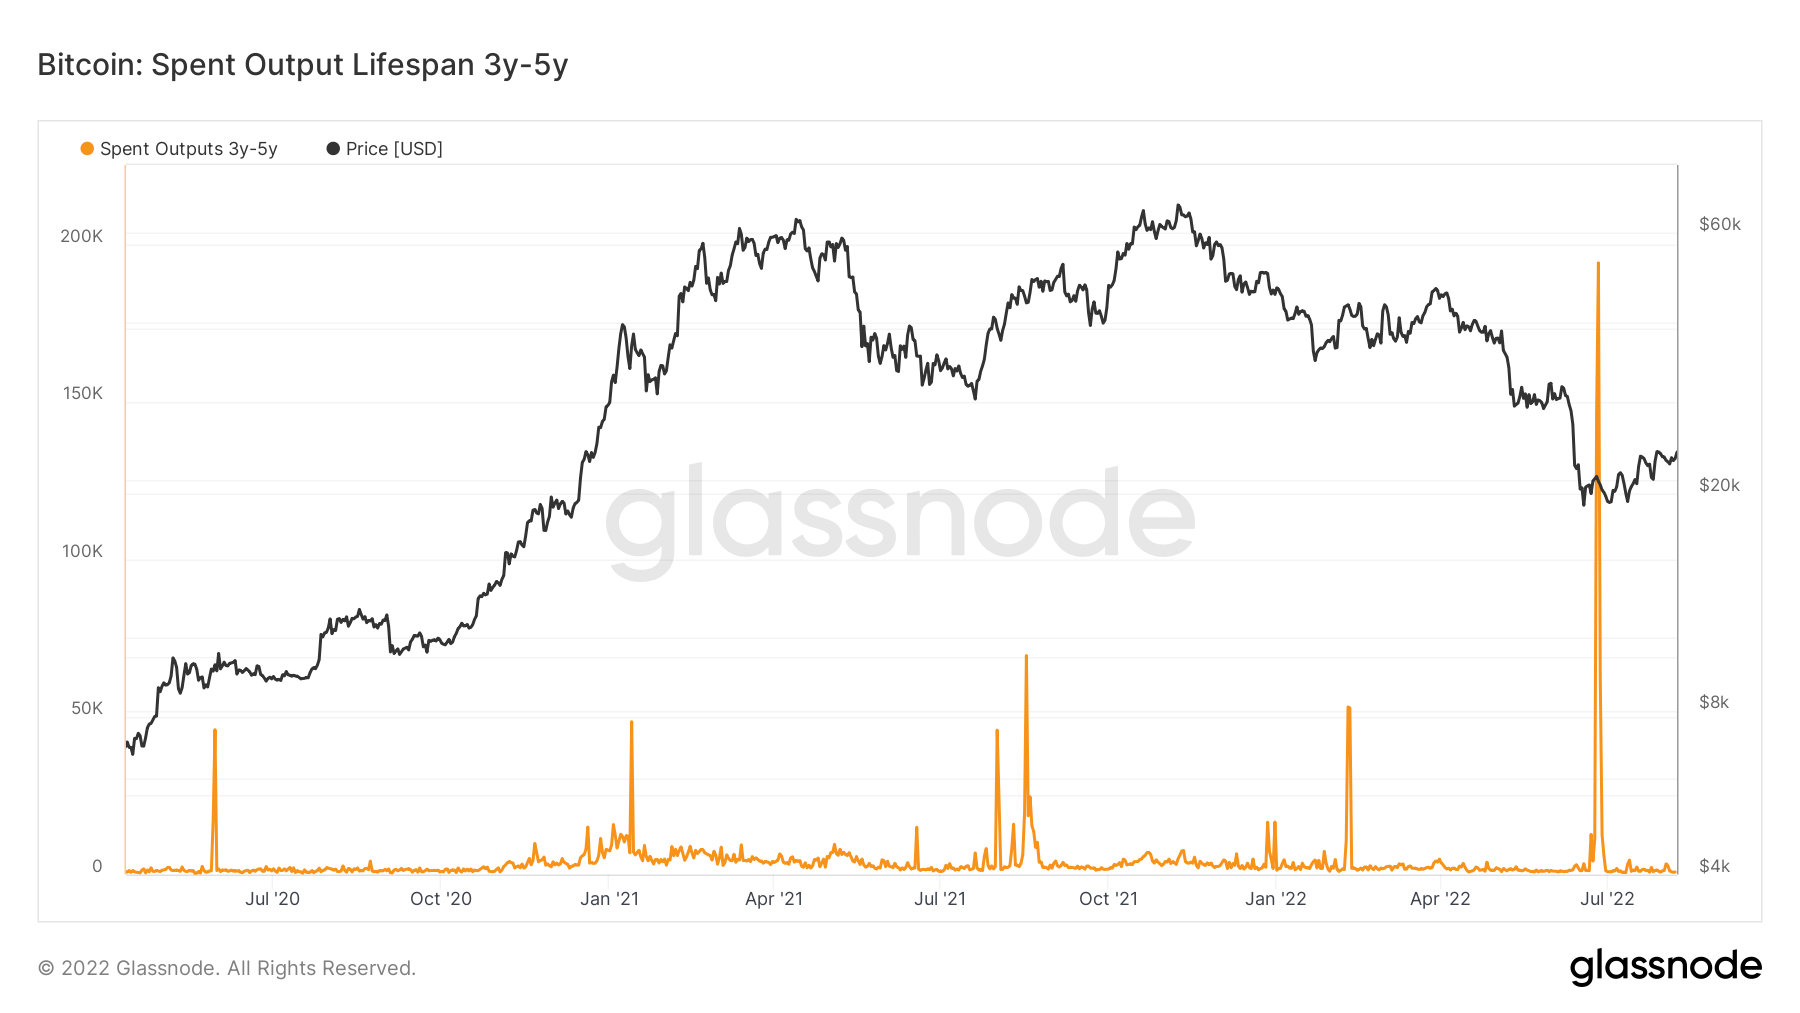
Bitcoin – Spent Outputs 3Y – 5Y
Bitcoin – Spent Outputs 5Y – 7Y
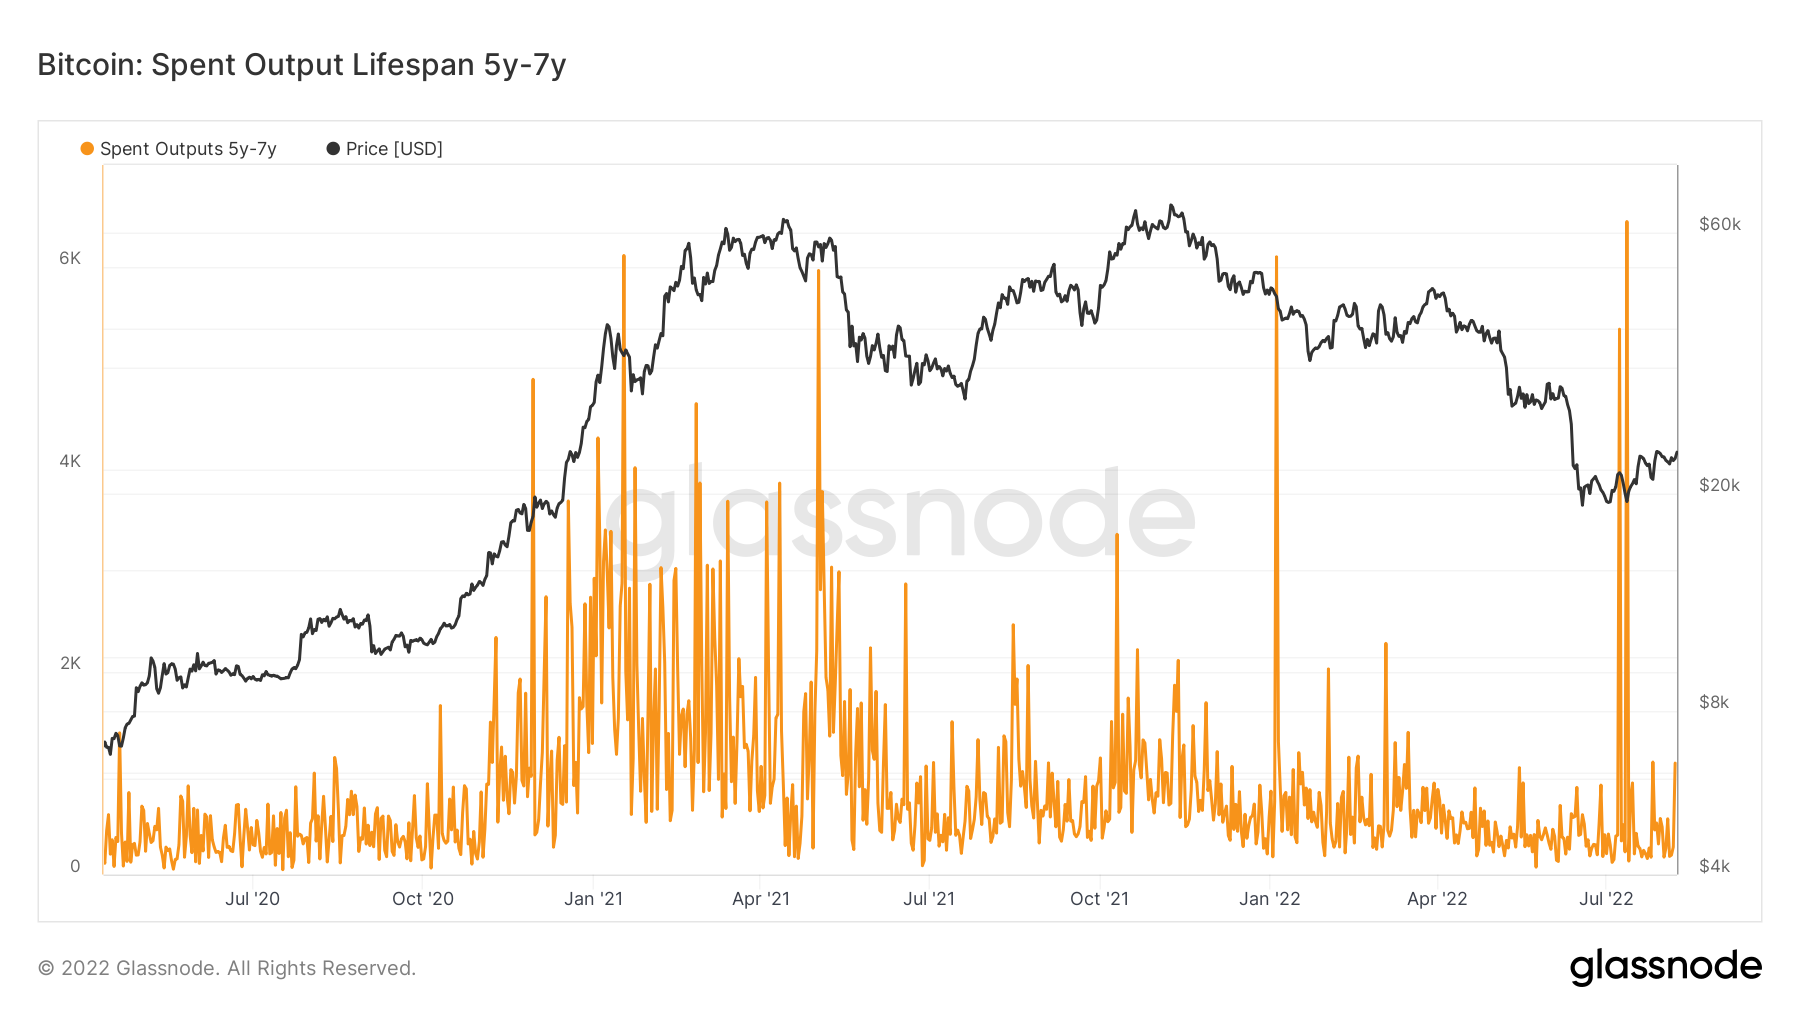
Looking at the above, we can see that a lot of old coins have been spent. This may be a panic from these cohorts that price is coming down further and further and becoming closer to their Realised Price and hence they have possibly chosen to sell into the very slightly higher prices we have seen over the last week or so.
Metric 3 – Net Realised Profit/Loss
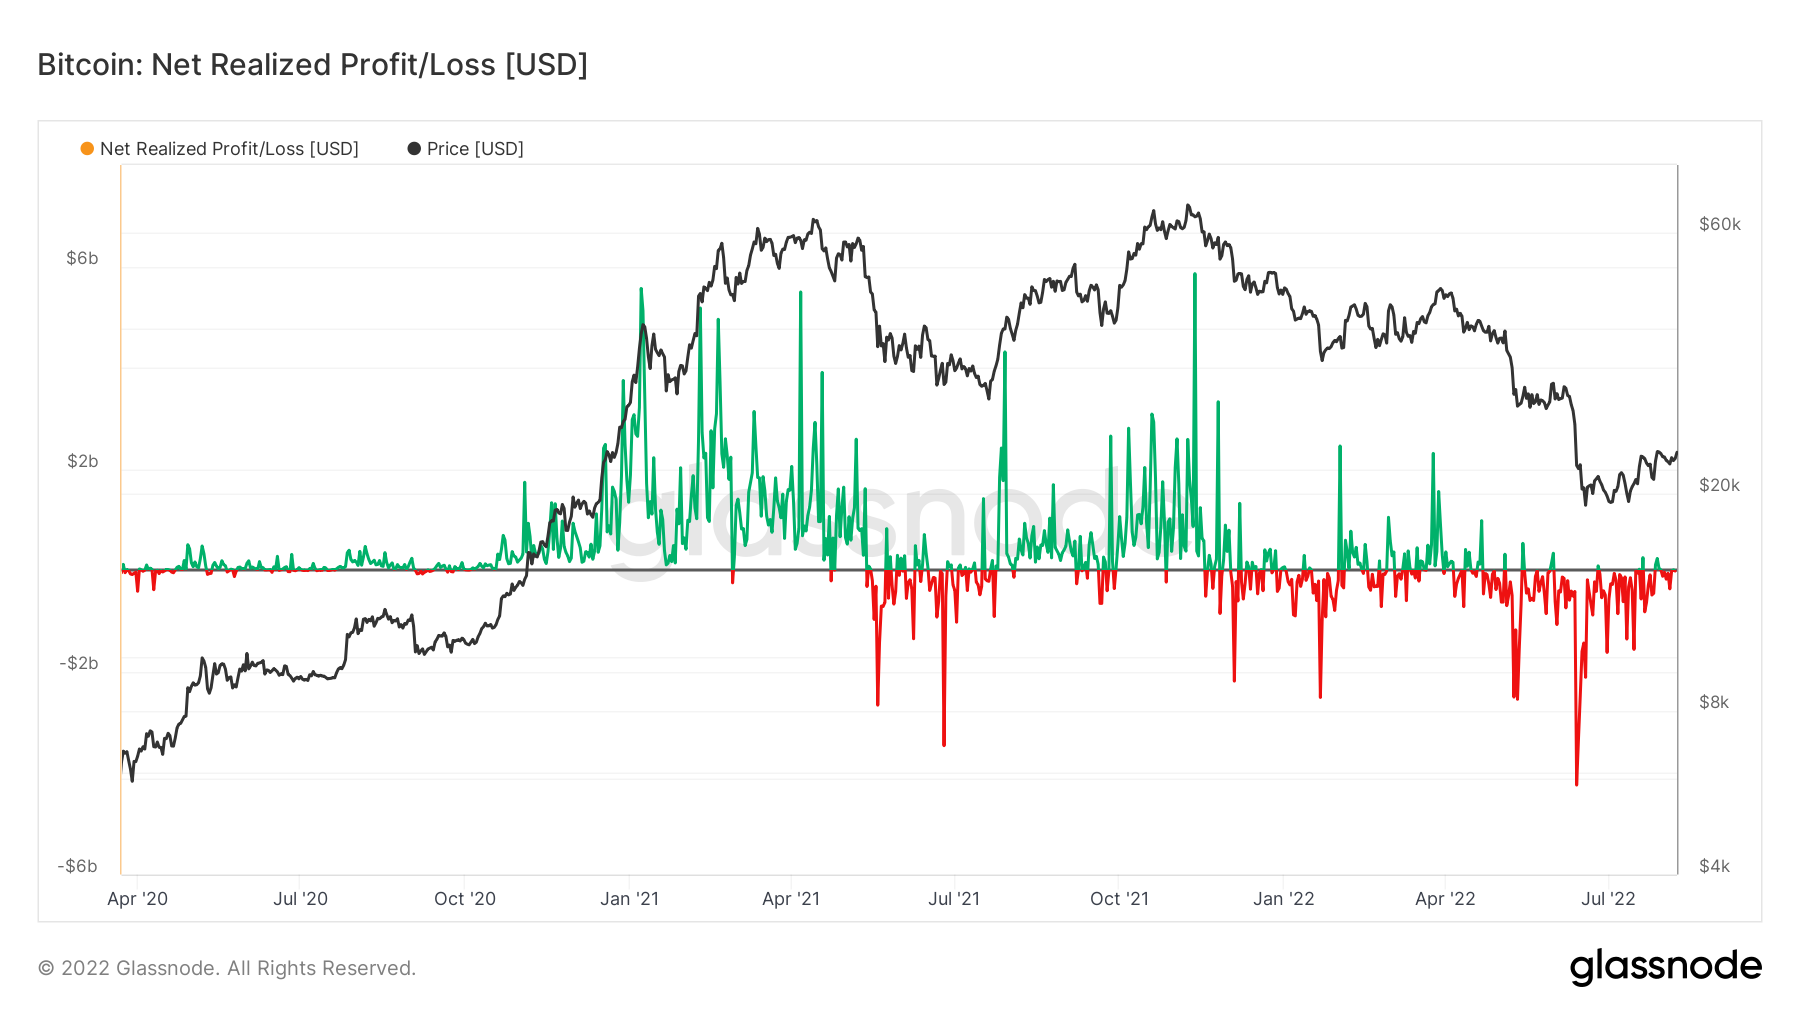
The Net Realised Profit/Loss is again another metric that we cover regularly as it gives a great indication of the current market sentiment. We can see below the clear difference between a bull and bear market. In the bull market this metric often shows large green spikes – an indication of investors realising large profits, whilst the black horizontal line acts as support. In a bear market, we see red spikes with the black horizontal line acting as resistance – investors realising losses. We are still seeing now that the black horizontal line is acting as strong resistance, indicating that investors don’t have the confidence to hold their coins and wait for higher prices before they sell at a profit. What they’re doing currently is just waiting for (and hoping) the price to come back to their break-even level and they can then sell and get out at break-even. Until we see this sentiment change, it’s unlikely that we’ll be able to get enough momentum to push prices much higher. This is a metric we will monitor on a daily basis.
Bitcoin – Net Realised Profit/Loss
 Metric 4 – Percent of UTXOs in Profit
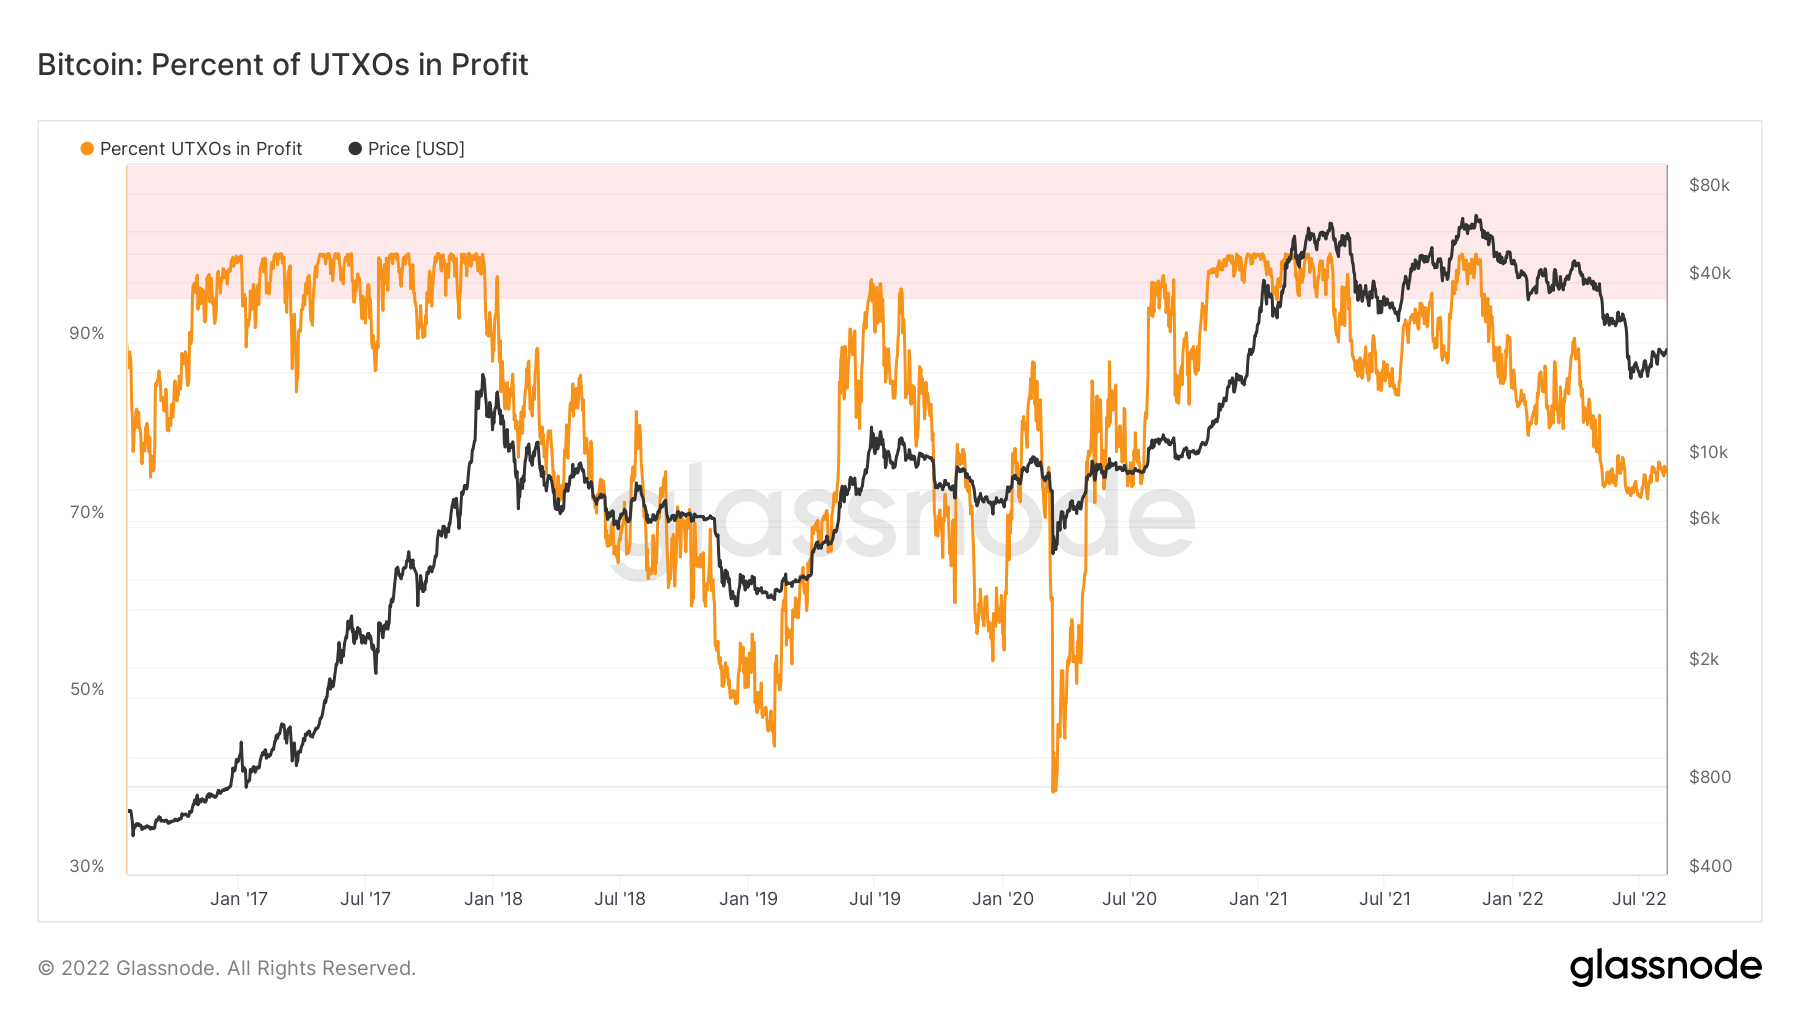
The last metric we will look at is the Percent of UTXOs in Profit. This is the percentage of unspent transaction outputs whose price at creation time was lower than the current price. We can see below that we are at 75% - 75% of all transaction outputs are in profits. If we look at the prior bear markets, the end of 2018 showed that only 45% of unspent transactions were in profit whilst the Covid low in March 2020 showed that just 40% of unspent transactions were in profit. This is far lower than the 75% we see now. This may mean there could be more room to come lower on this metric as perhaps enough pain hasn’t been felt in the market yet to really strike out a bottom.
Metric 4 – Percent of UTXOs in Profit
The last metric we will look at is the Percent of UTXOs in Profit. This is the percentage of unspent transaction outputs whose price at creation time was lower than the current price. We can see below that we are at 75% - 75% of all transaction outputs are in profits. If we look at the prior bear markets, the end of 2018 showed that only 45% of unspent transactions were in profit whilst the Covid low in March 2020 showed that just 40% of unspent transactions were in profit. This is far lower than the 75% we see now. This may mean there could be more room to come lower on this metric as perhaps enough pain hasn’t been felt in the market yet to really strike out a bottom.
Bitcoin – Percent UTXOs in Profit
Ether - Technical & On-Chain Analysis
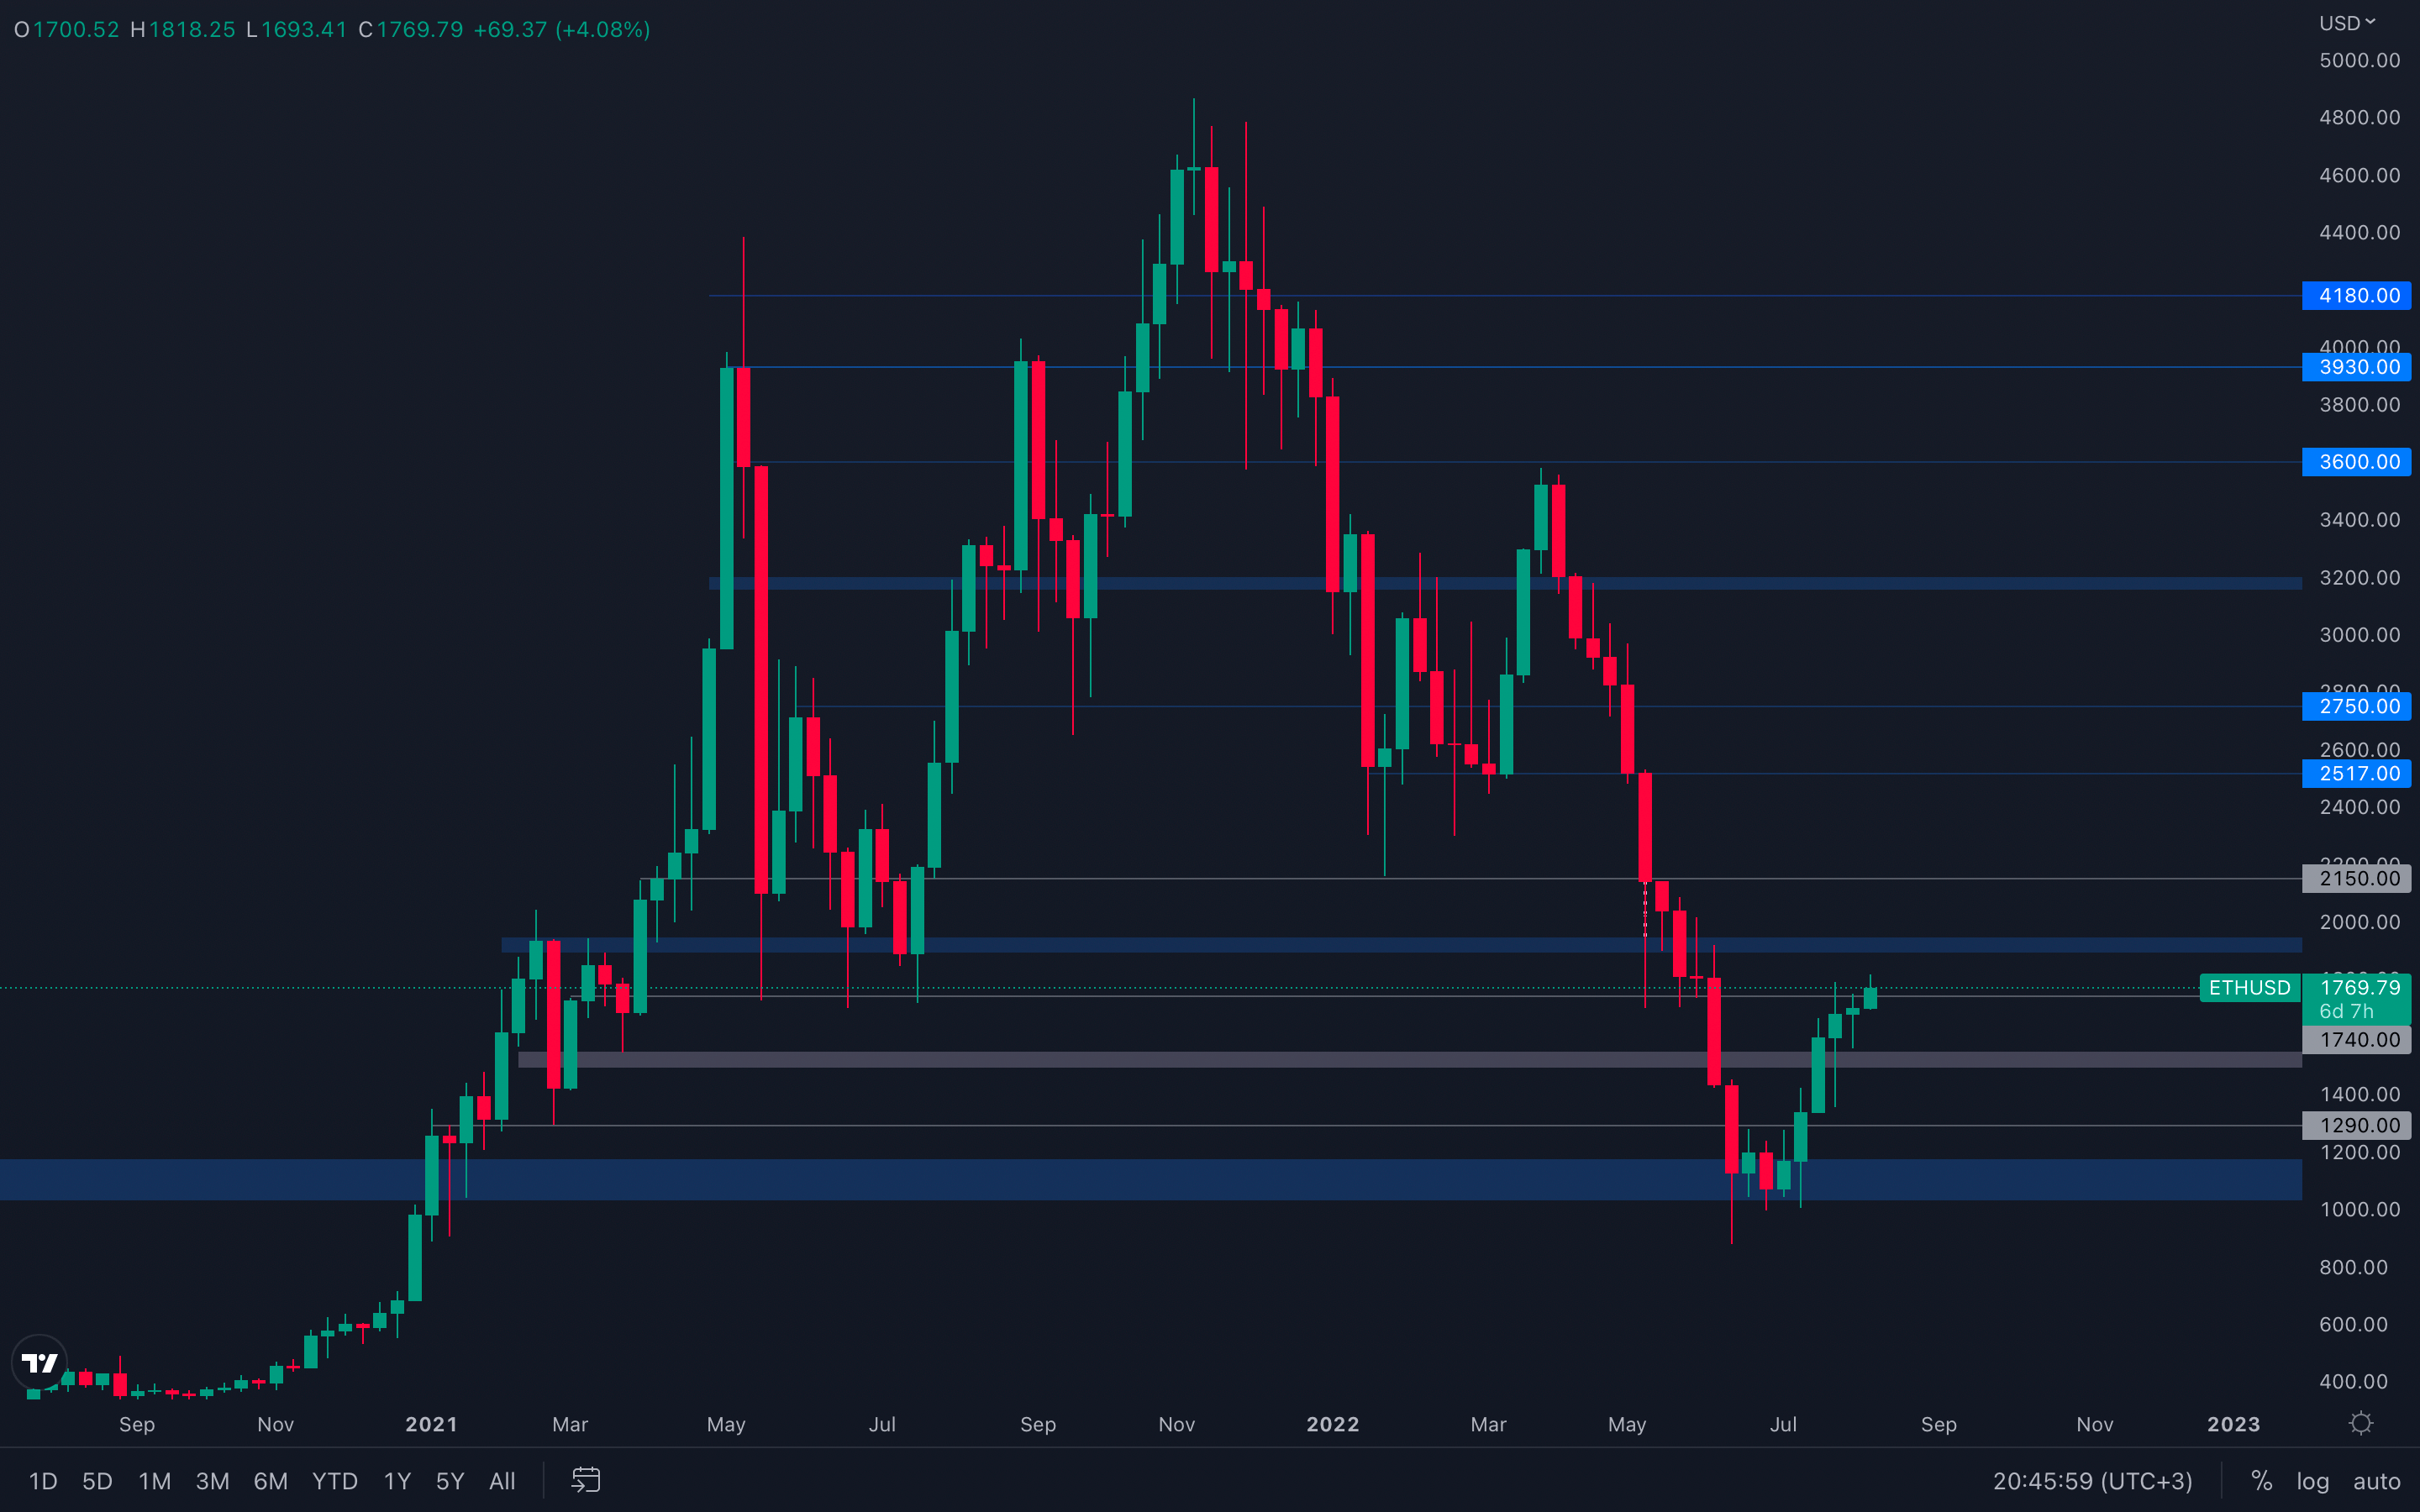 Incredible performance from Ether, which is why most altcoins have managed to perform well over the last few weeks. Although we have no weekly closure above $1740 yet, Ether seems ready to break above this resistance level, as its volume has also been increasing in the last few weeks. In order to properly confirm a move towards $1900 - $2000, Ether now needs to close a weekly candle above $1740, and a weekly candle under $1500 to invalidate further upside. For now, we should stick with daily data, as ETH is about to close a daily candle above $1740 - this will lead its price towards the $1900 - $2000 resistance area, where we could finally see buyers losing strength.
Metric 1 – Addresses (Overview)
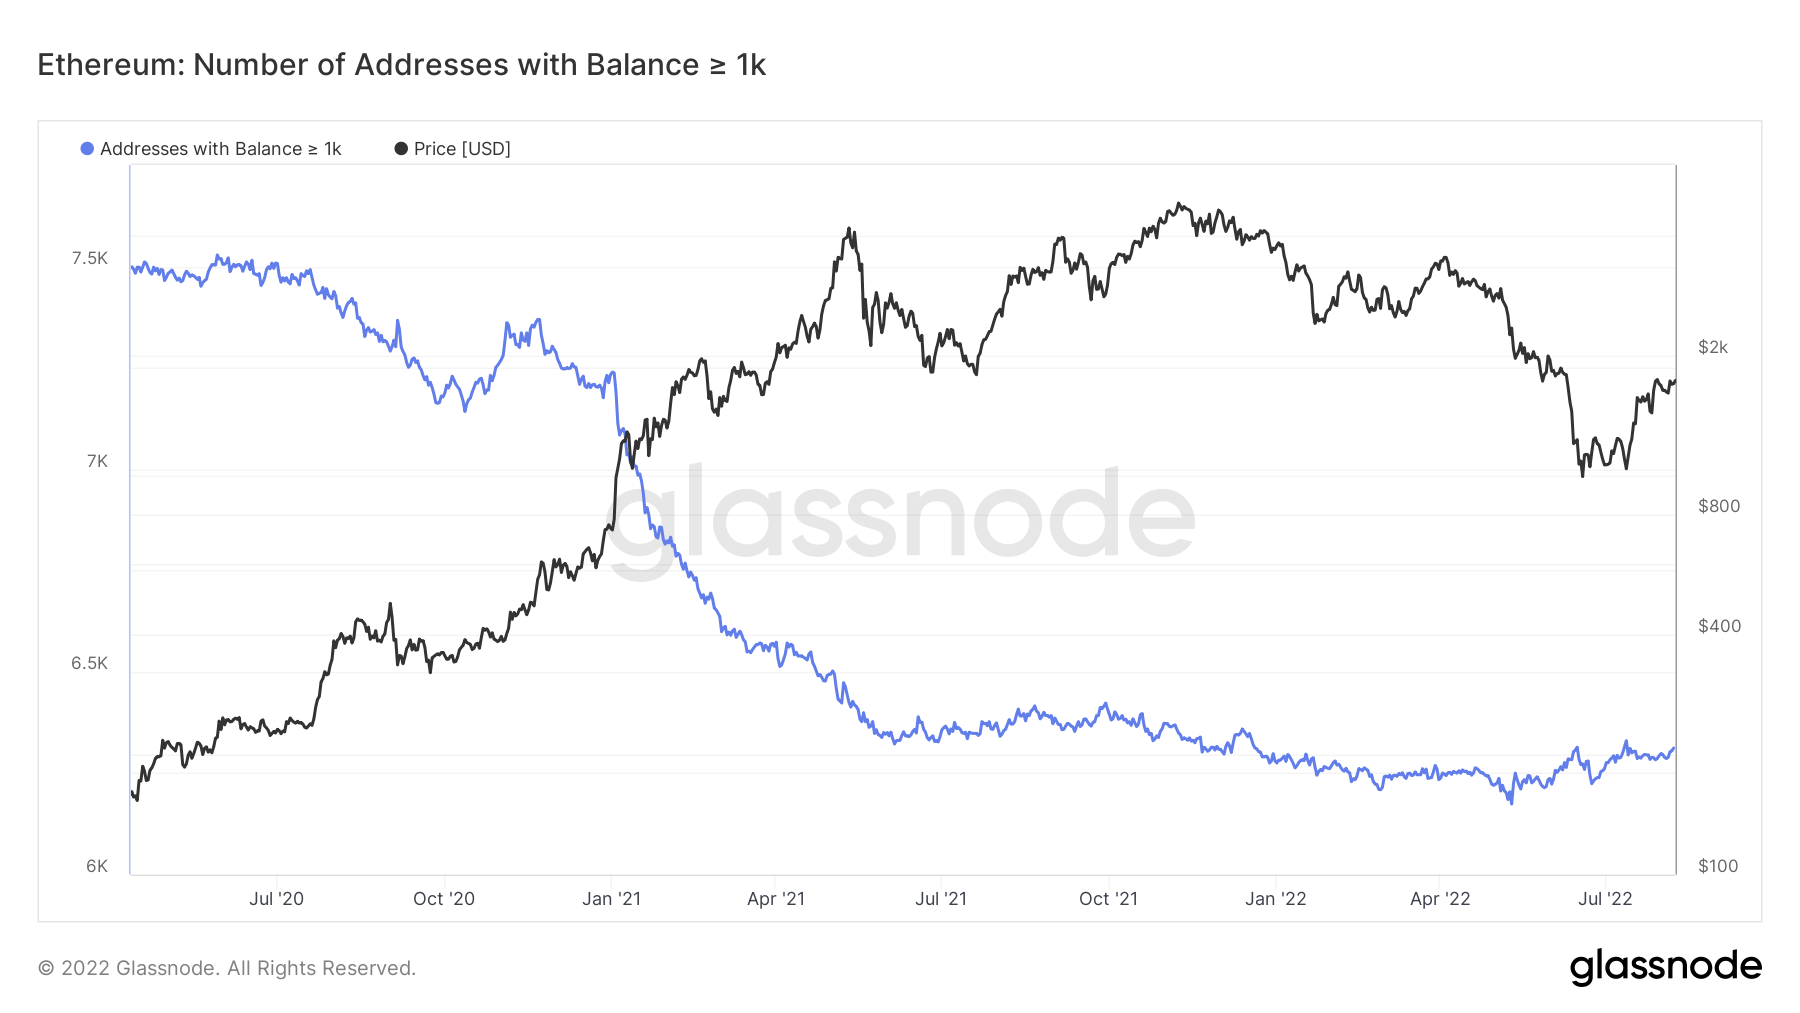
If we look at the same metric for Ether, we can see that a slight uptrend is forming, however not with any real acceleration…for now. Again, this is something we will have to keep monitoring to help us identify if this is just fomo’ing in during this (what we believe is) a bear market rally, or if it is the beginning of a more significant uptrend.
Ether – Addresses with Balance > 1,000 Ether
DOT
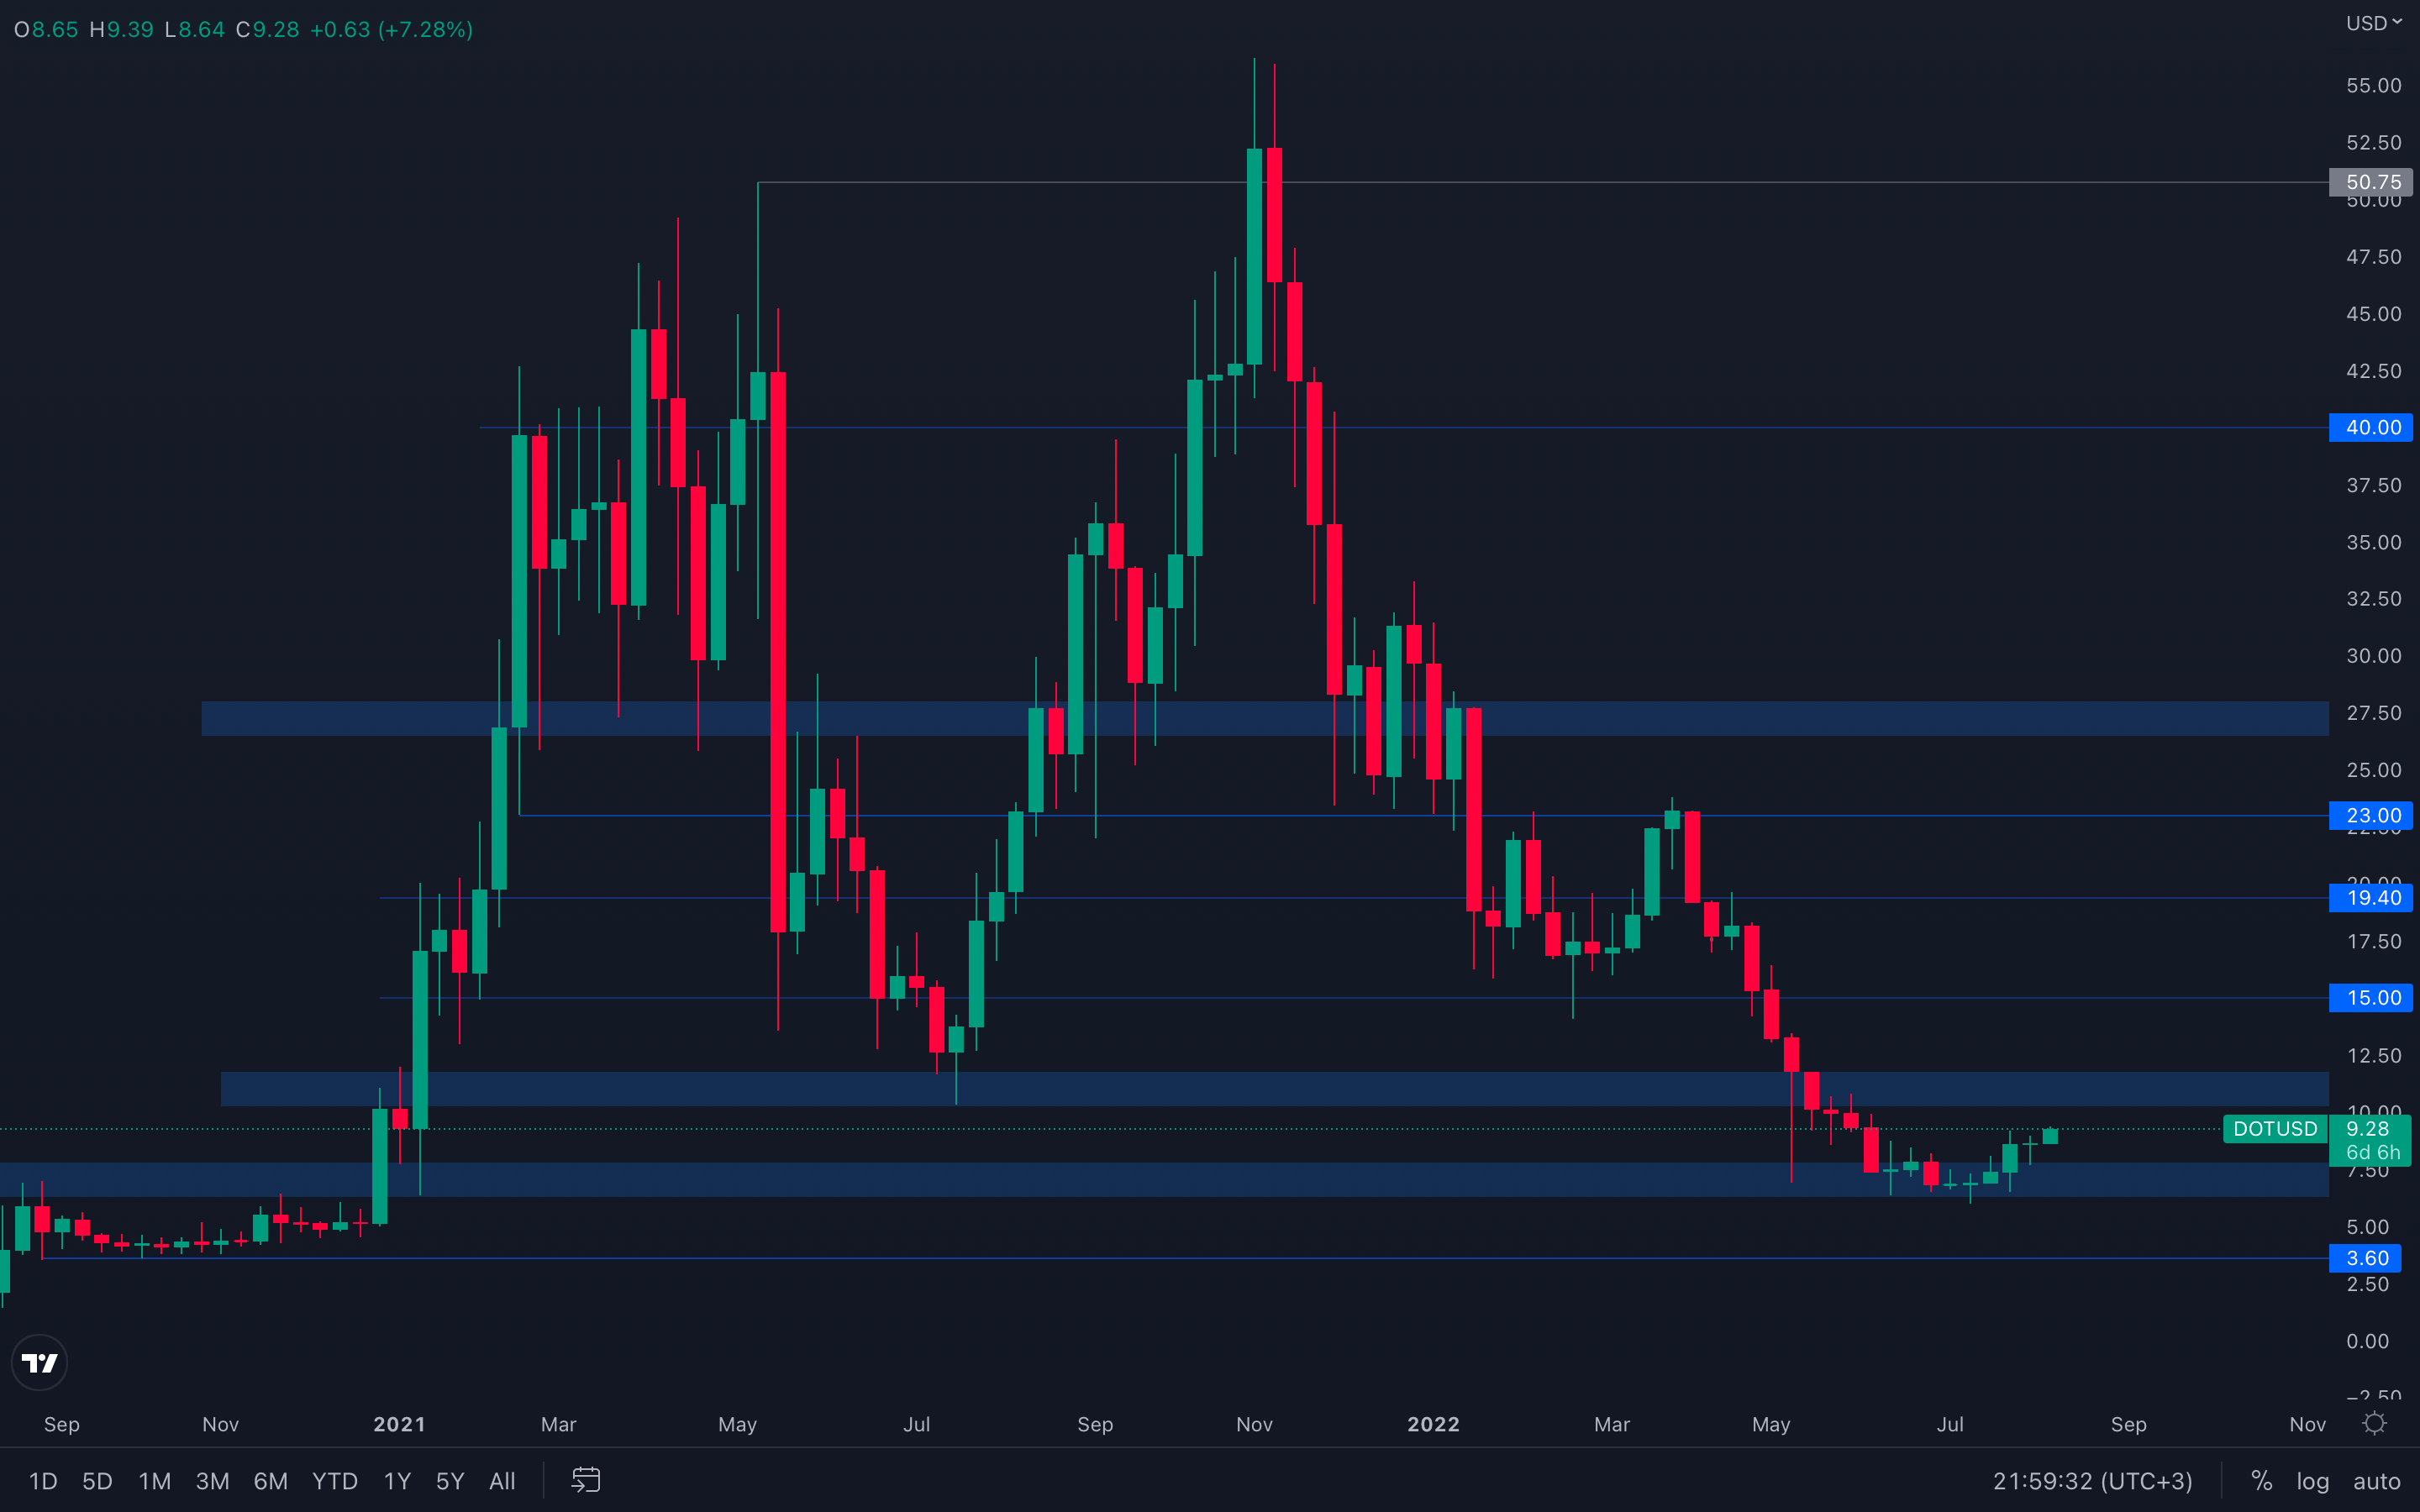 Nothing stopping DOT from reaching its $10 level - we've been talking about this level for quite some time after DOT registered a candlestick bottoming pattern consisting of indecisive candles, also known as Doji. These candles only reflected the fact that neither direction could've been indicated until $7.75 or $6.30 were broken on the weekly timeframe, something we've seen happening just two weeks ago. We recommend caution around the $10 - $12.50 resistance area, however, as the majors are still not suggesting much confidence and could easily bring DOT's price back down.
SNX
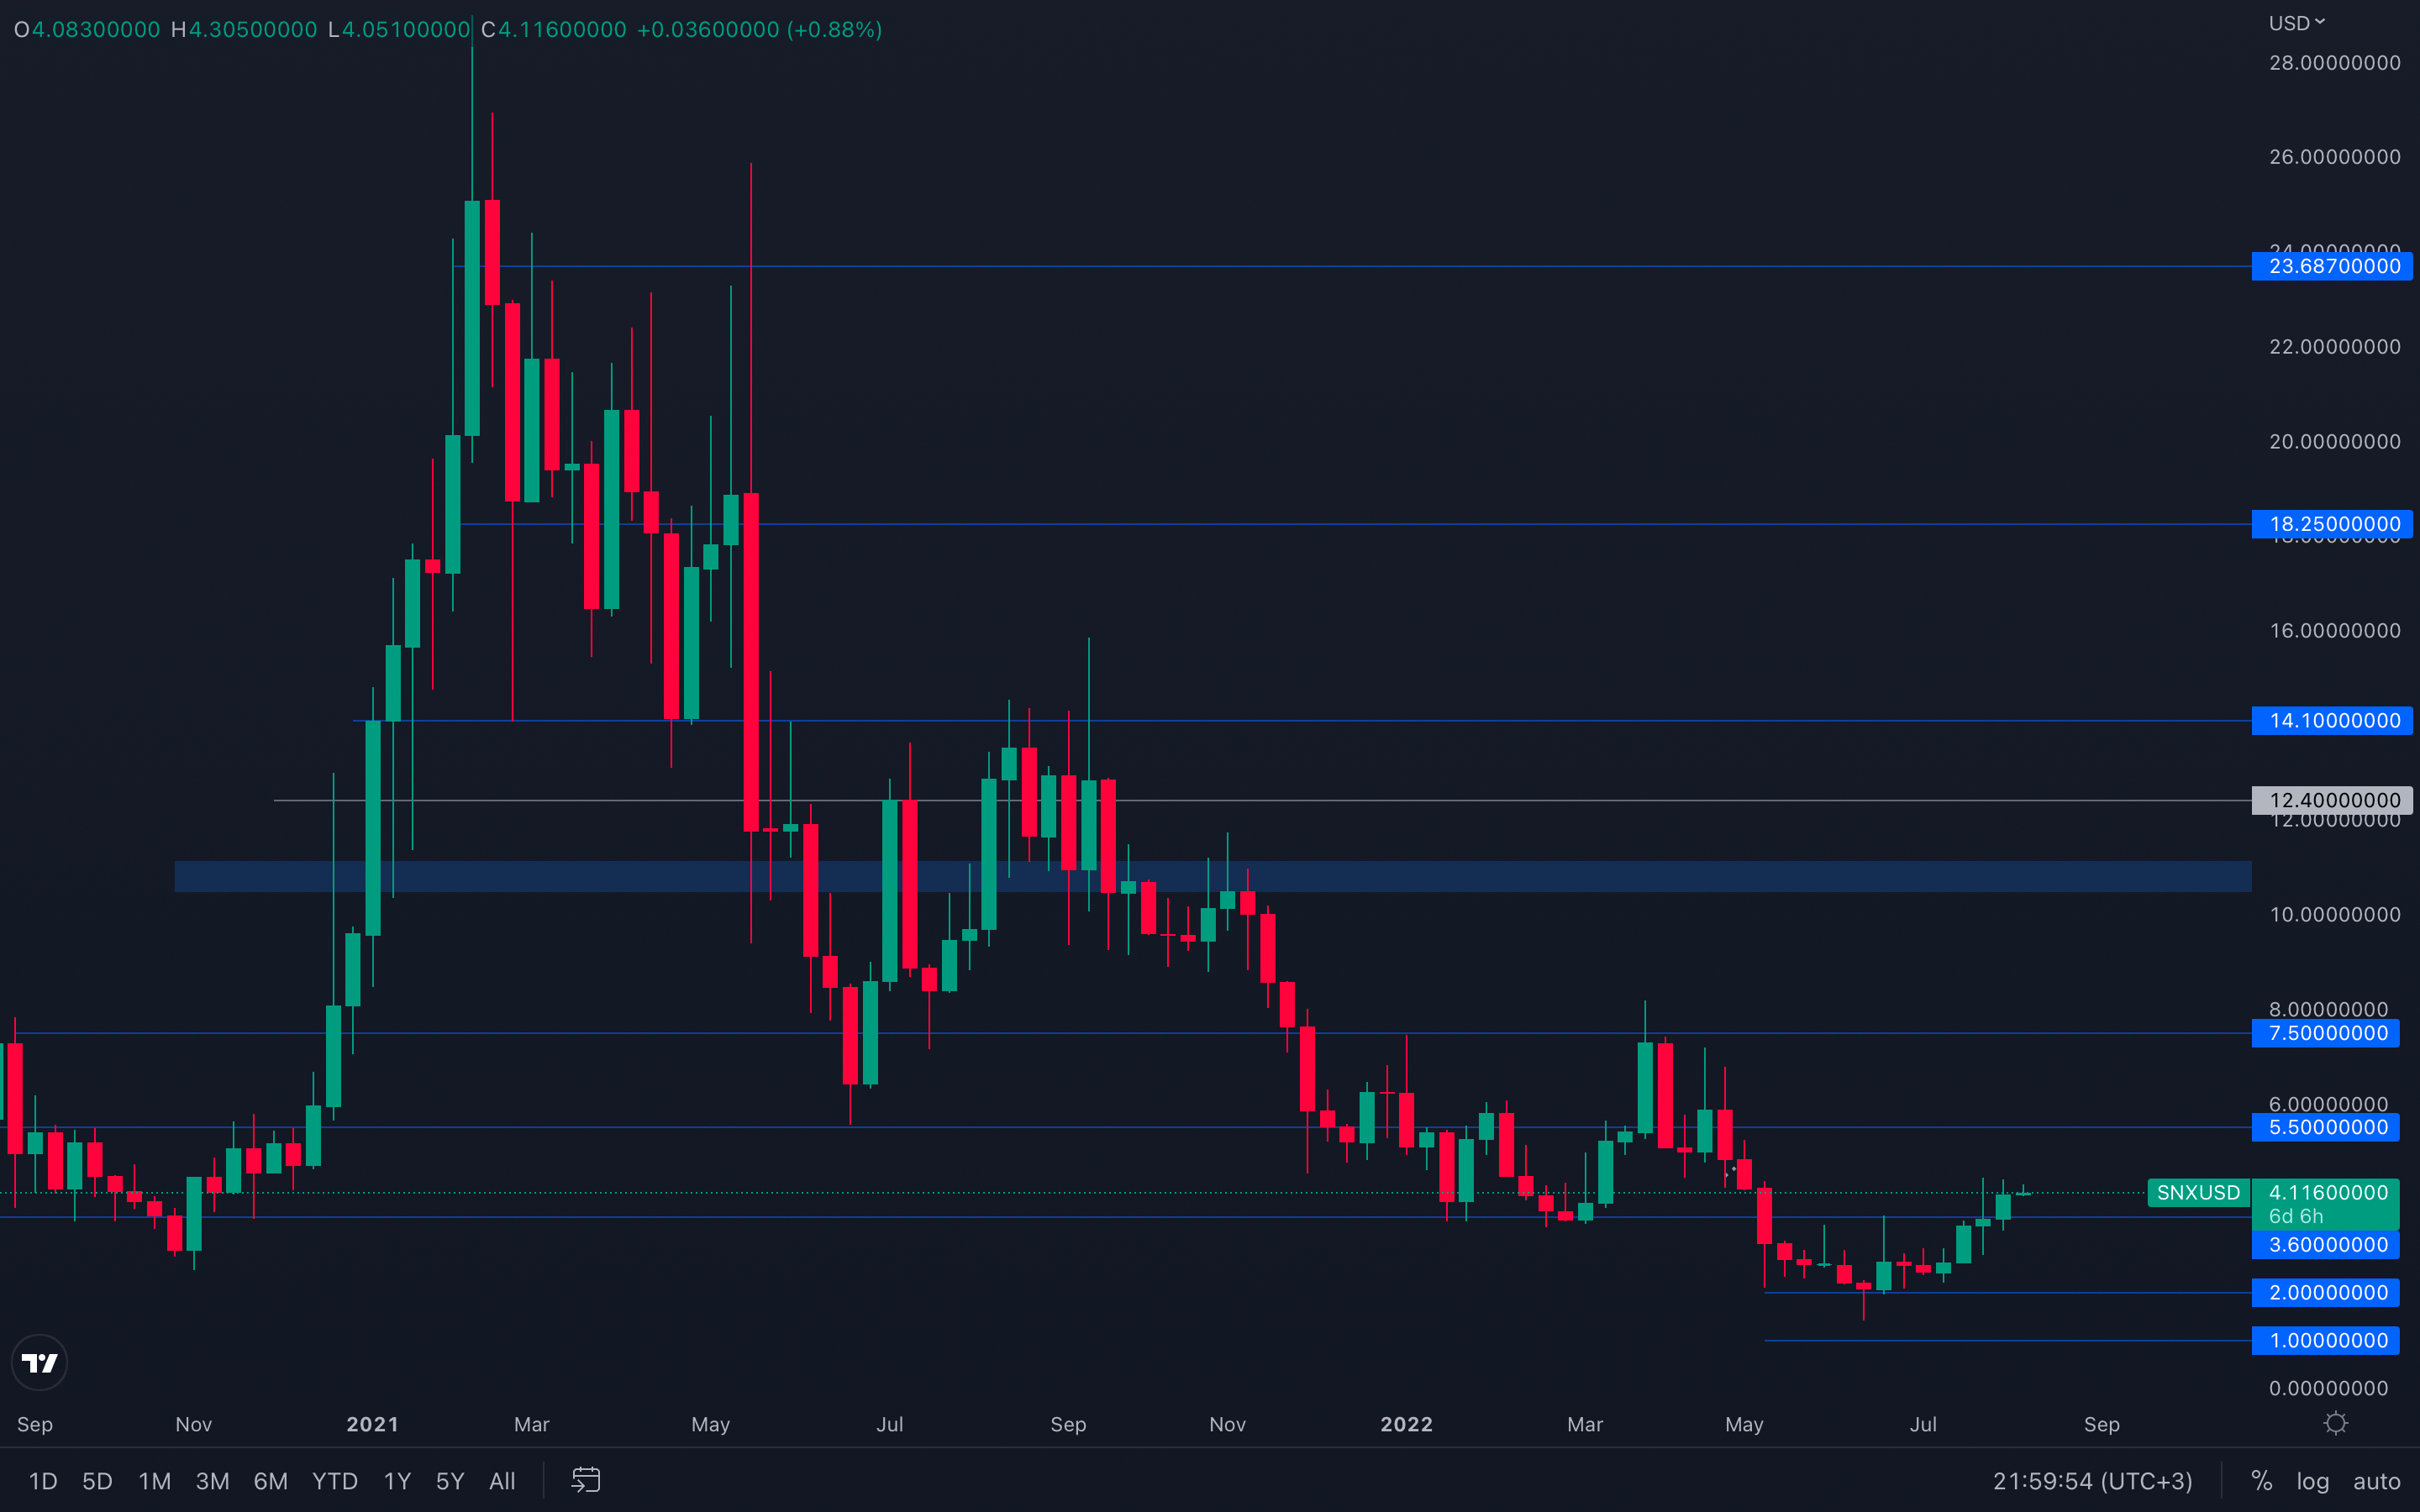 SNX successfully reclaimed its $3.60 level, but hasn't retested it as of yet - this puts the asset in a "wait and see mode", as it could still go higher due to the majors' influence on its price, but it could also retest $3.6 and continue to rise from there. Although there's strength in SNX's price action, something we can deduce from its high volume, there's no clear direction until either a $3.60 retest or a $5.5 resistance test occur.
RUNE
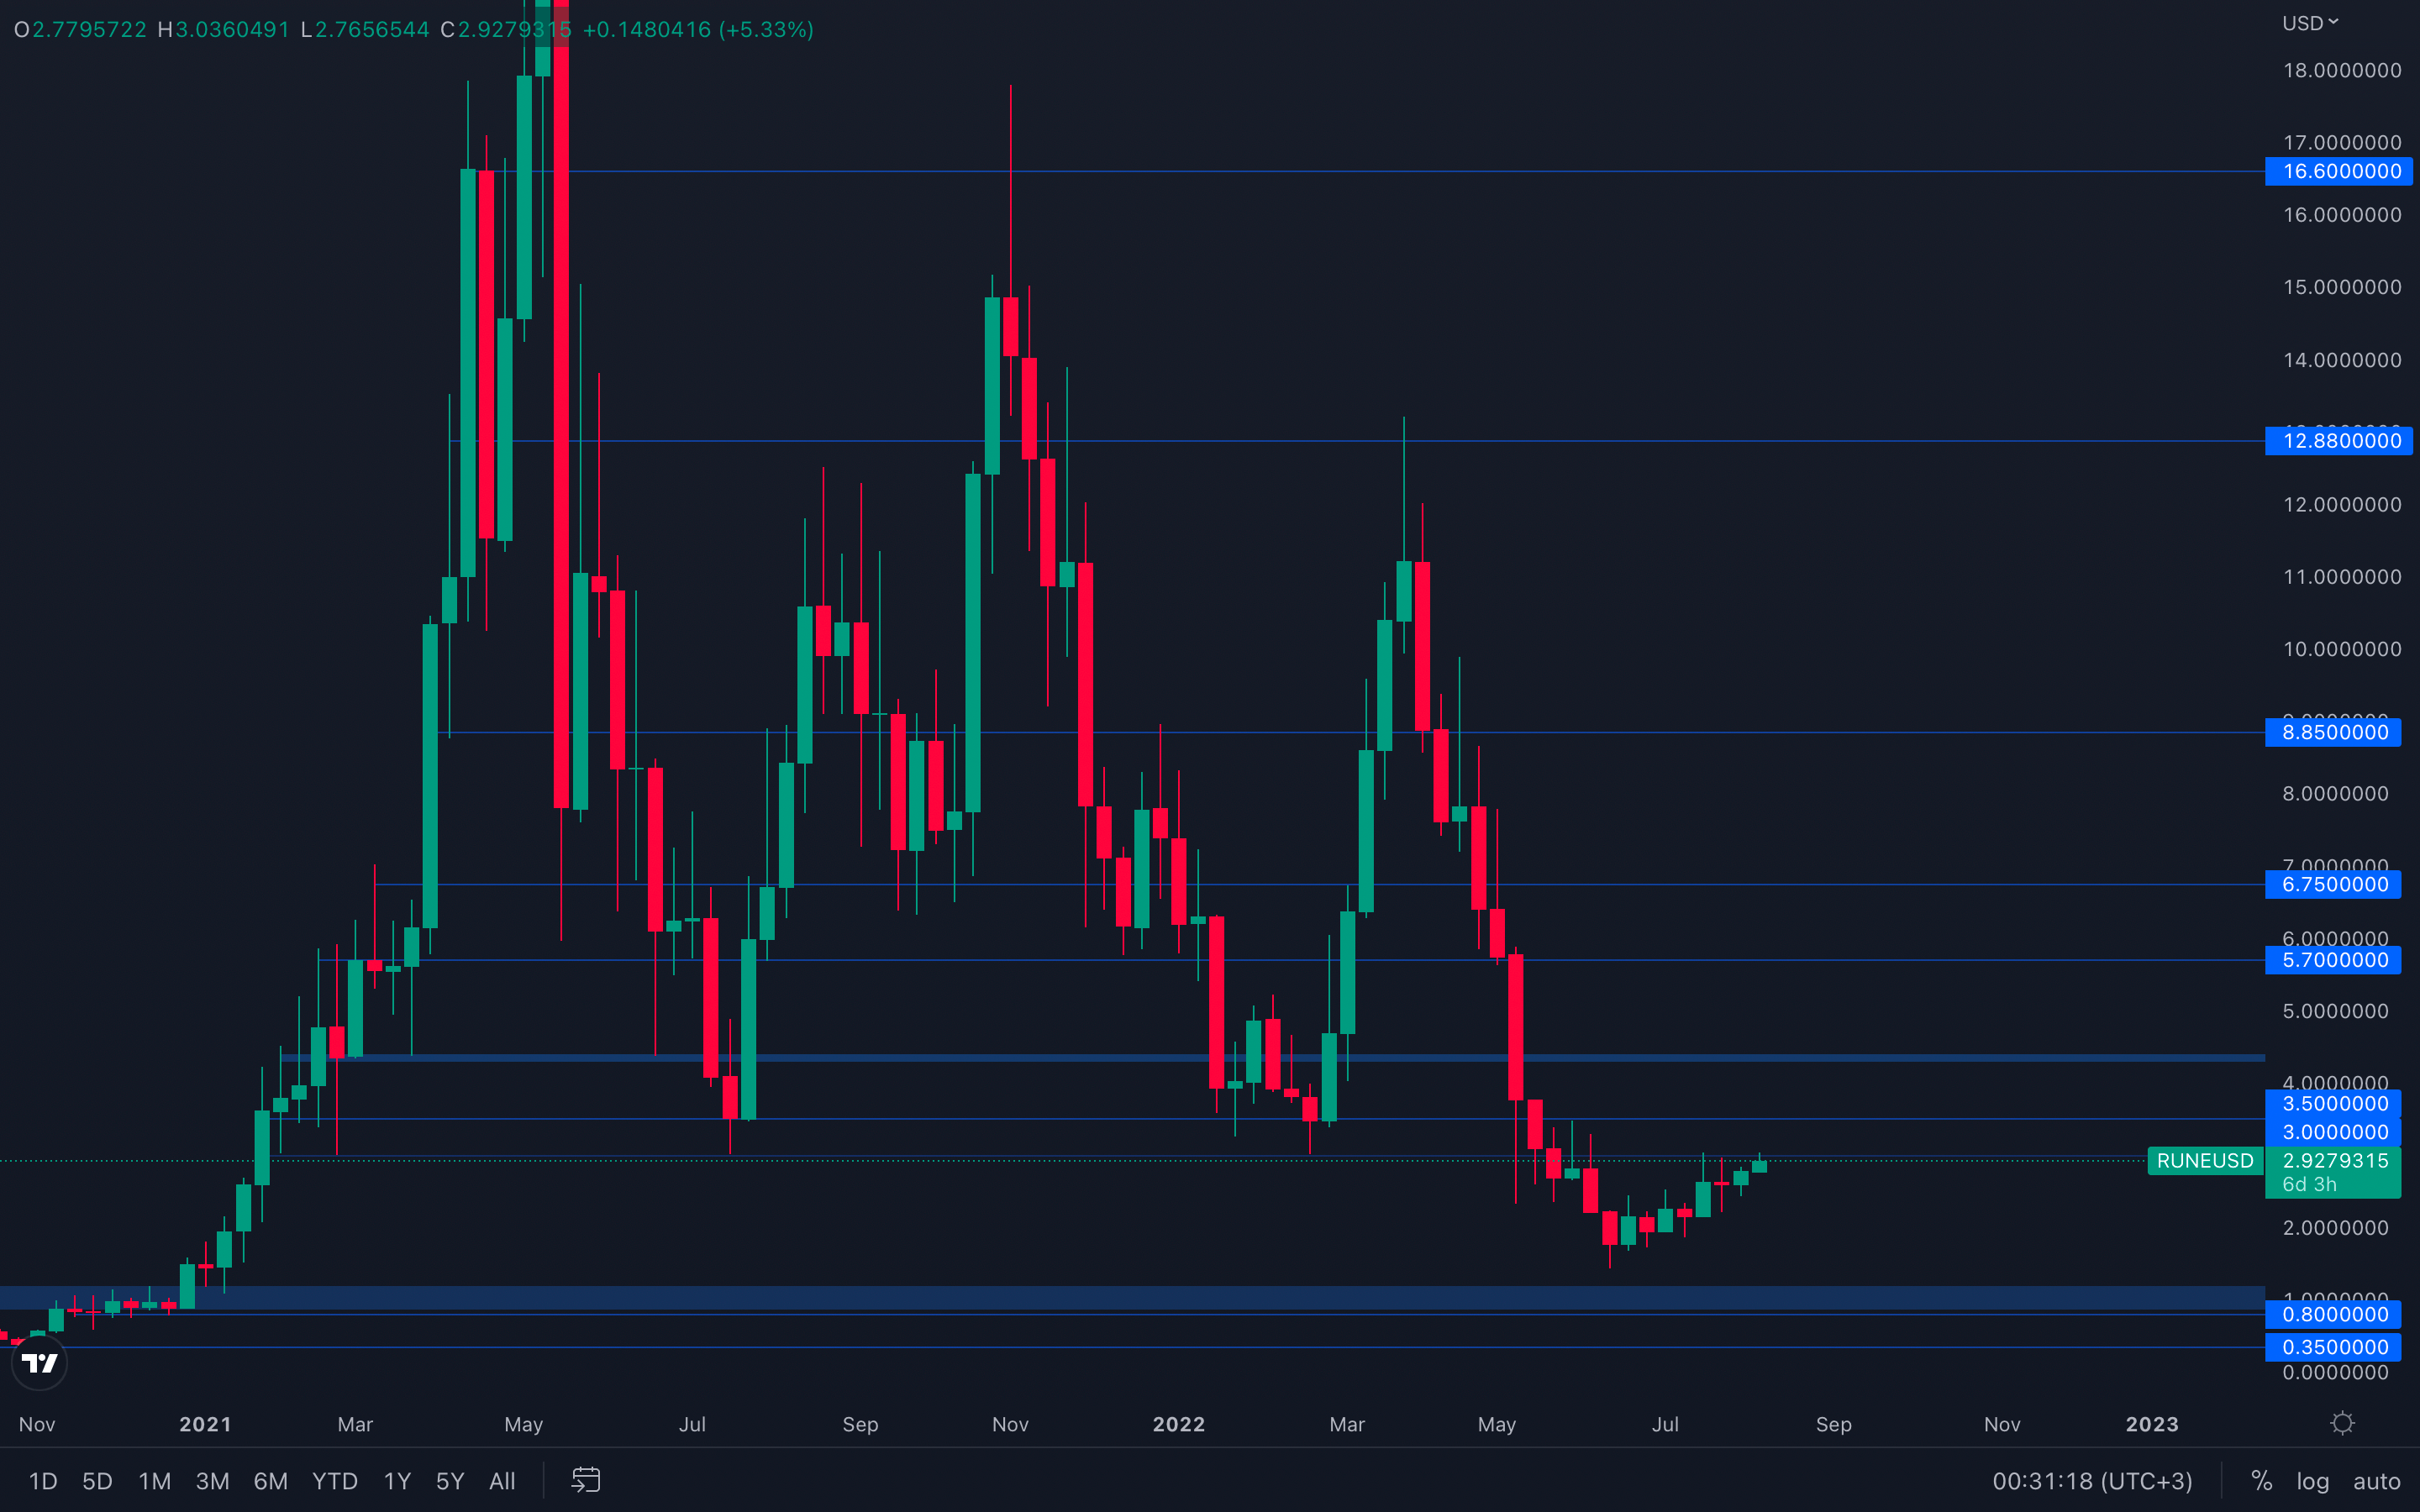 No significant change in RUNE's price action other than the fact that it finally reached its $3 level. This has acted as a major support level multiple times in the past, which makes it one of the most important out of them all. A weekly reclaim of $3 is necessary in order to confirm further upside, otherwise RUNE risks getting rejected and head lower. As usual, we will continue to monitor RUNE on a daily basis in case any changes worth mentioning occur.
SOL
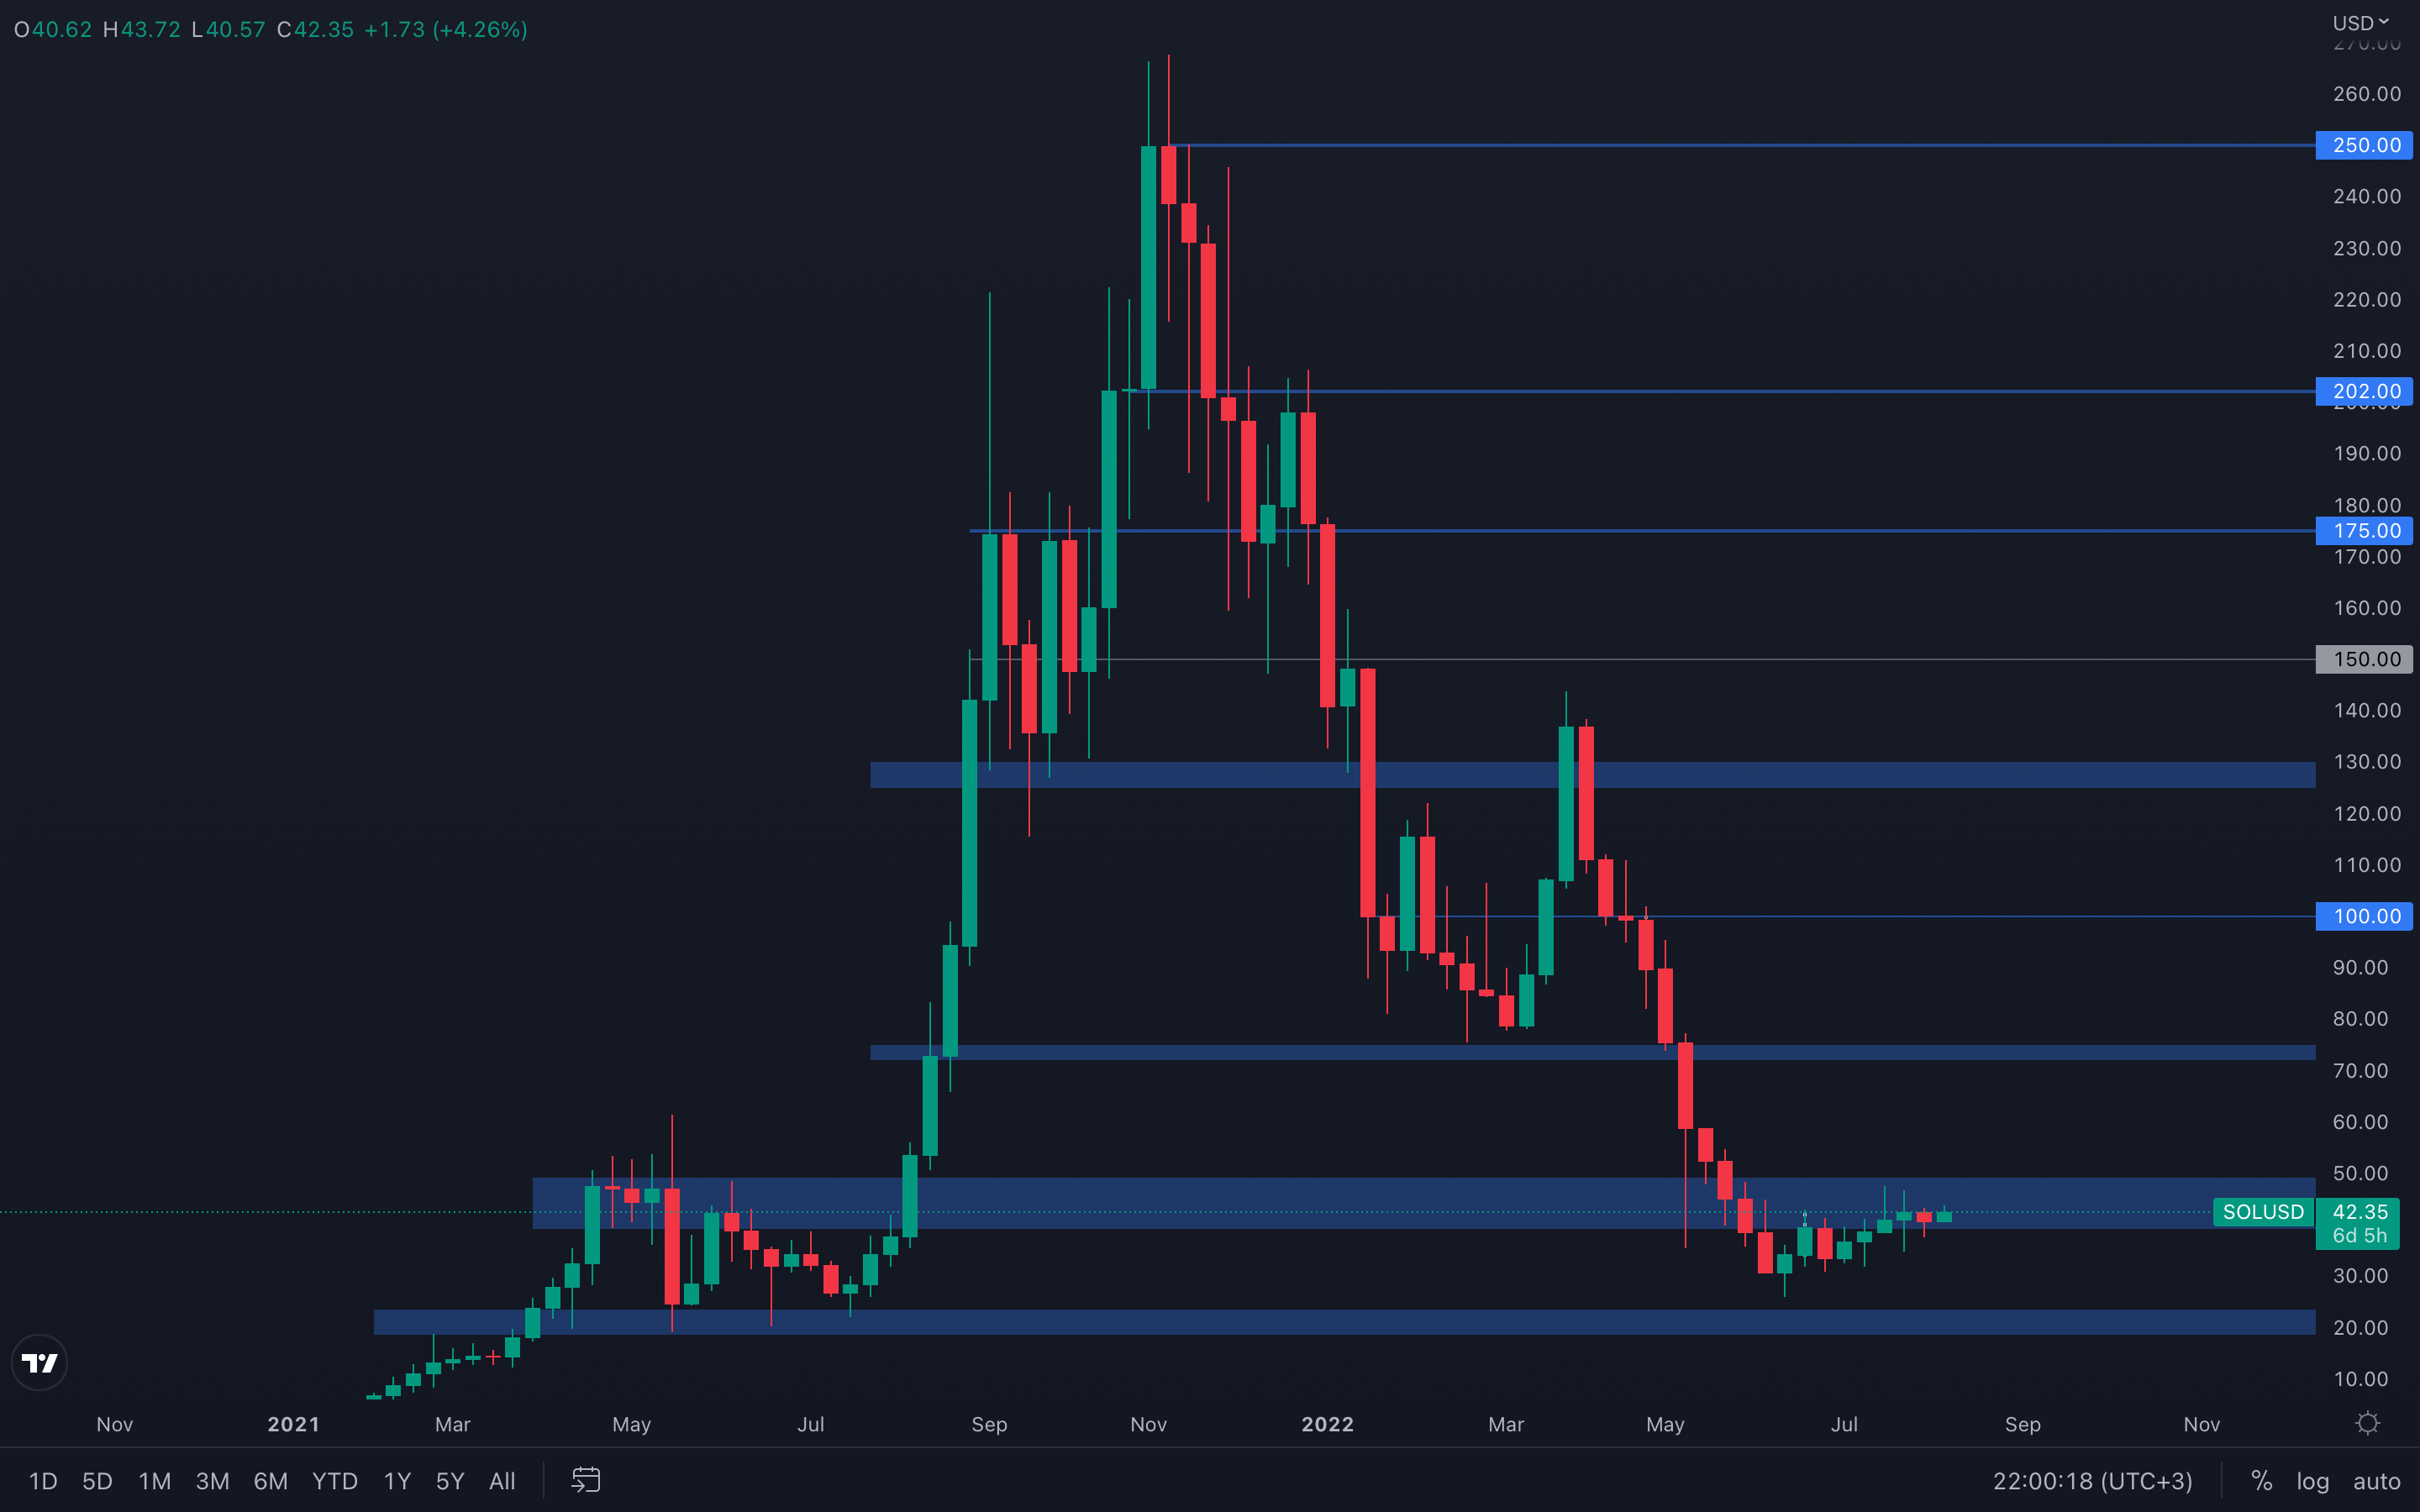 Bit of a slow down in SOL's price - last week, SOL closed bearish unlike most assets in this report. If you've been following our daily analysis from inside the Discord, you also know about the channel we've been tracking, and SOL is still on a path toward $47.50 for now, as no changes that might suggest otherwise occured, such as a loss of $36.
SRM
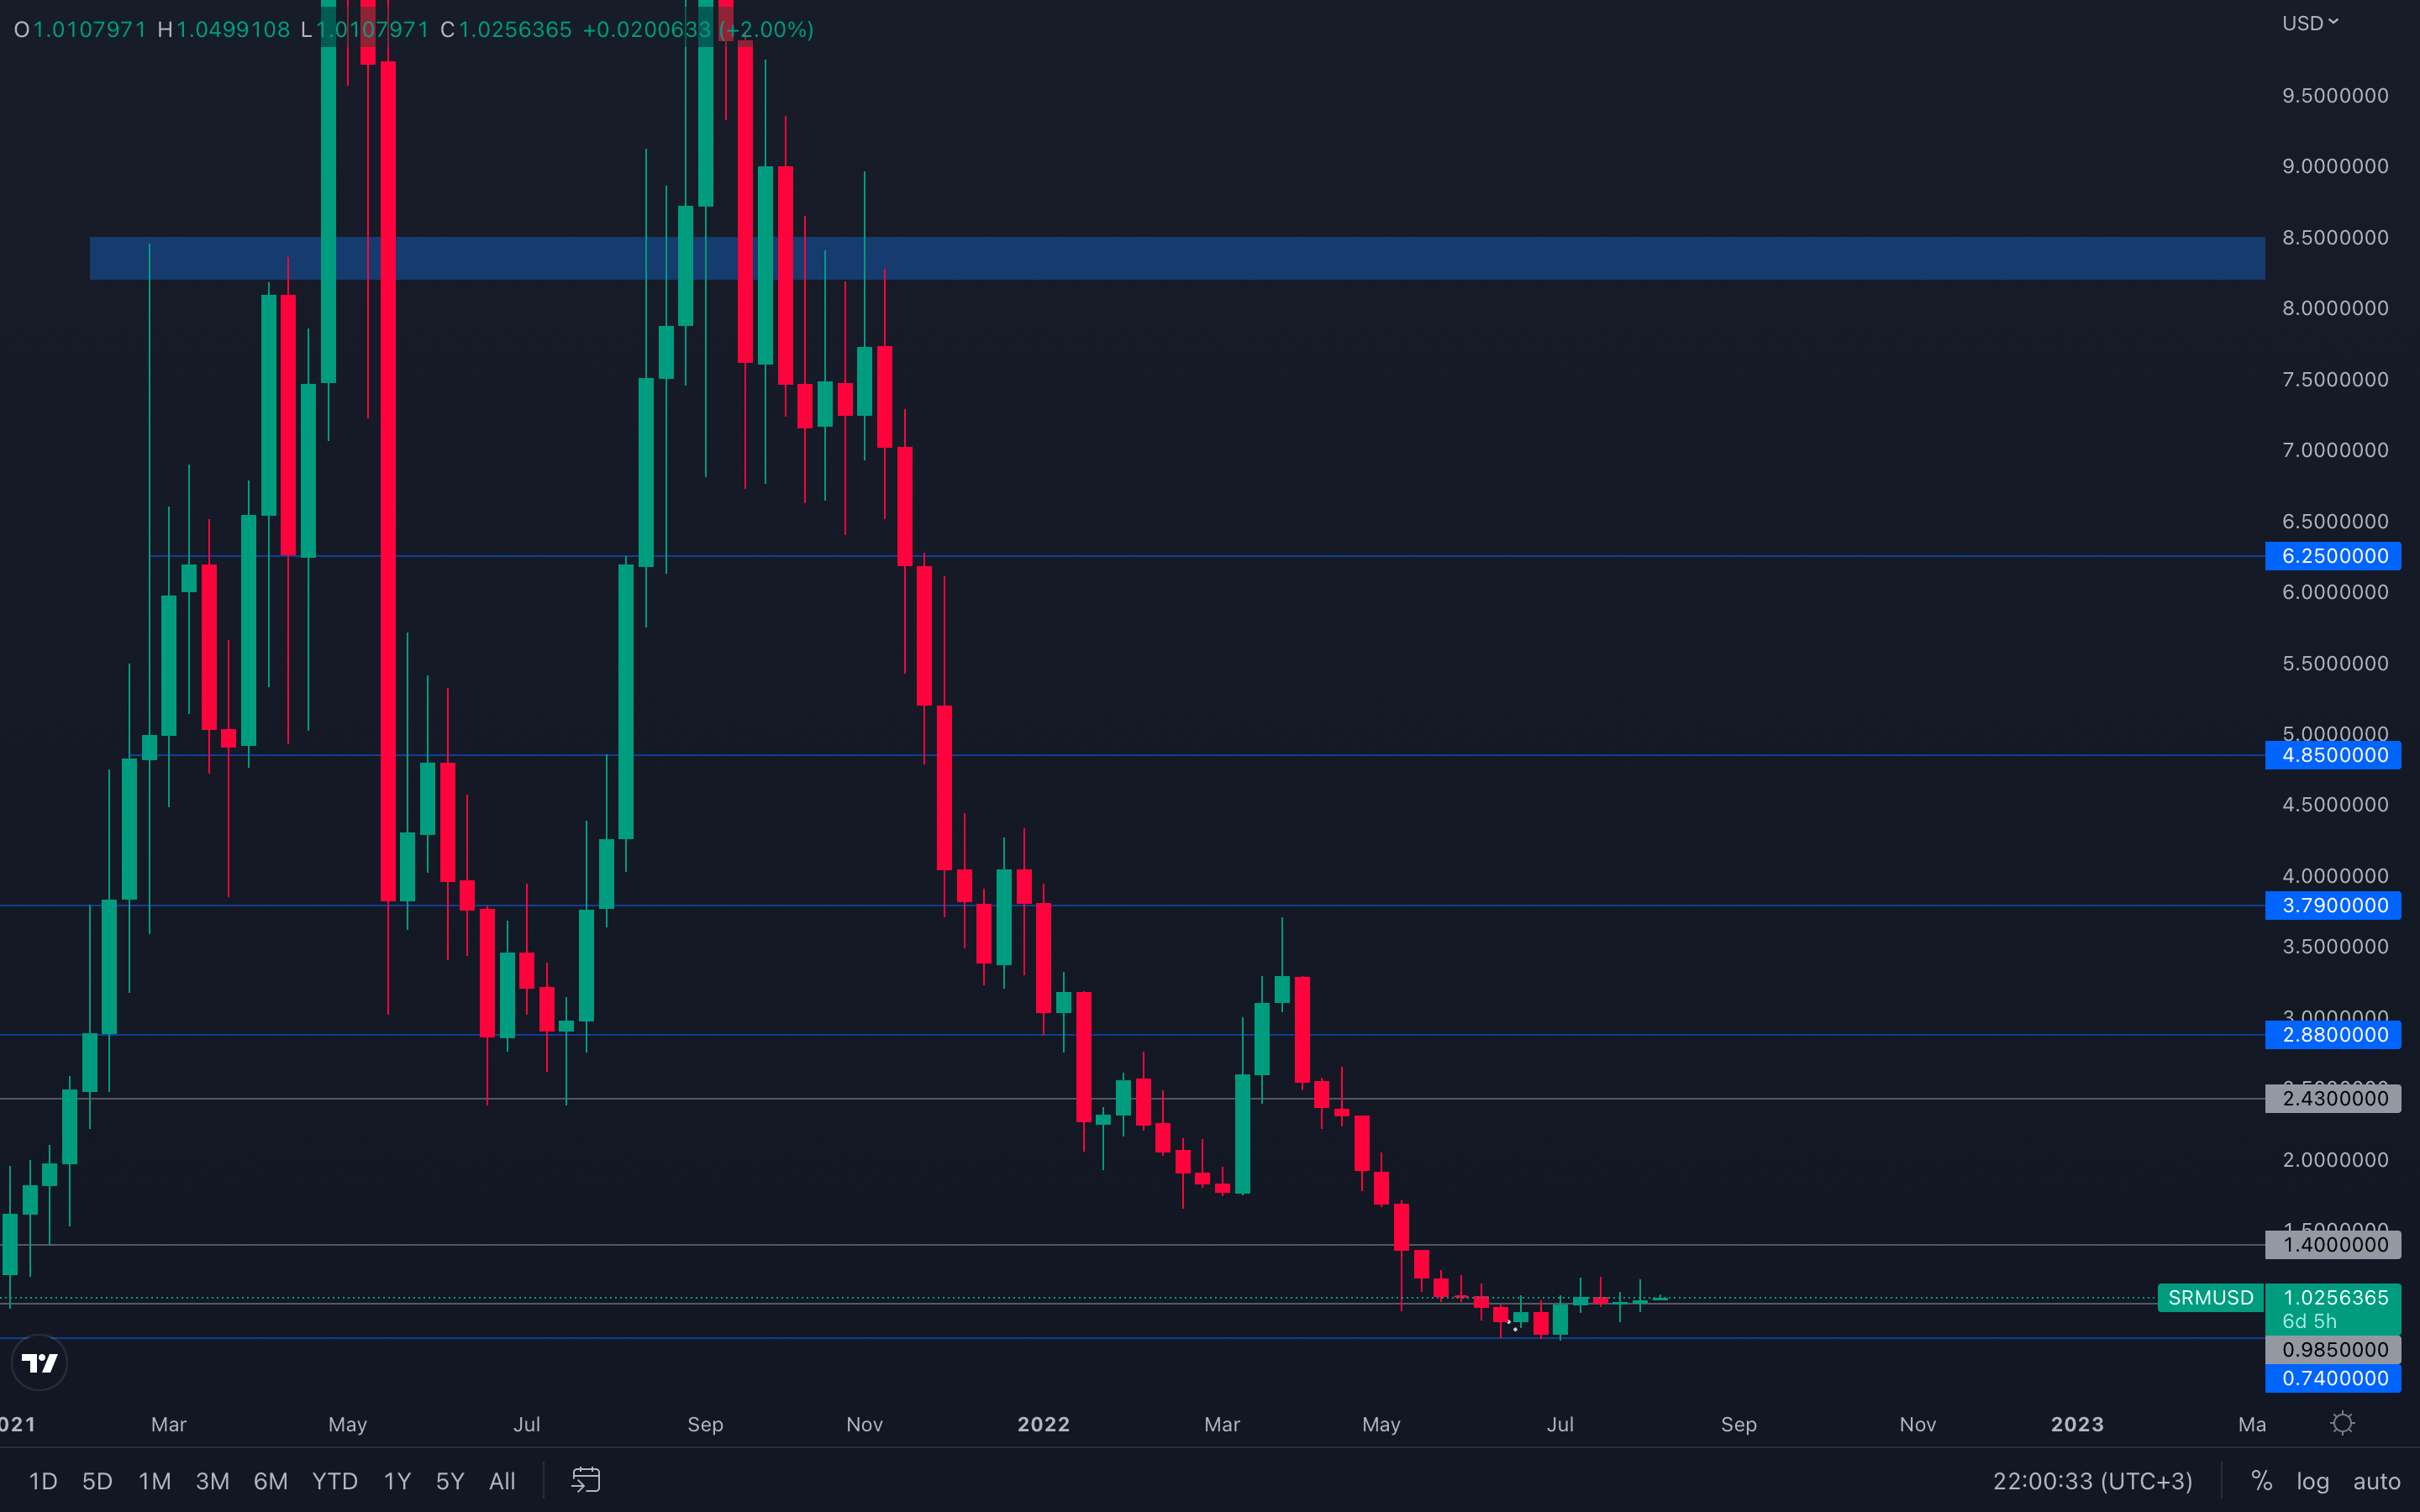 Still battling with its $1 level, SRM barely managed to close above it last week which might indicate decreased strenght. However, a reclaim of $1 cannot be ignored, so at least for now, $1.40 is on the cards.
FTT
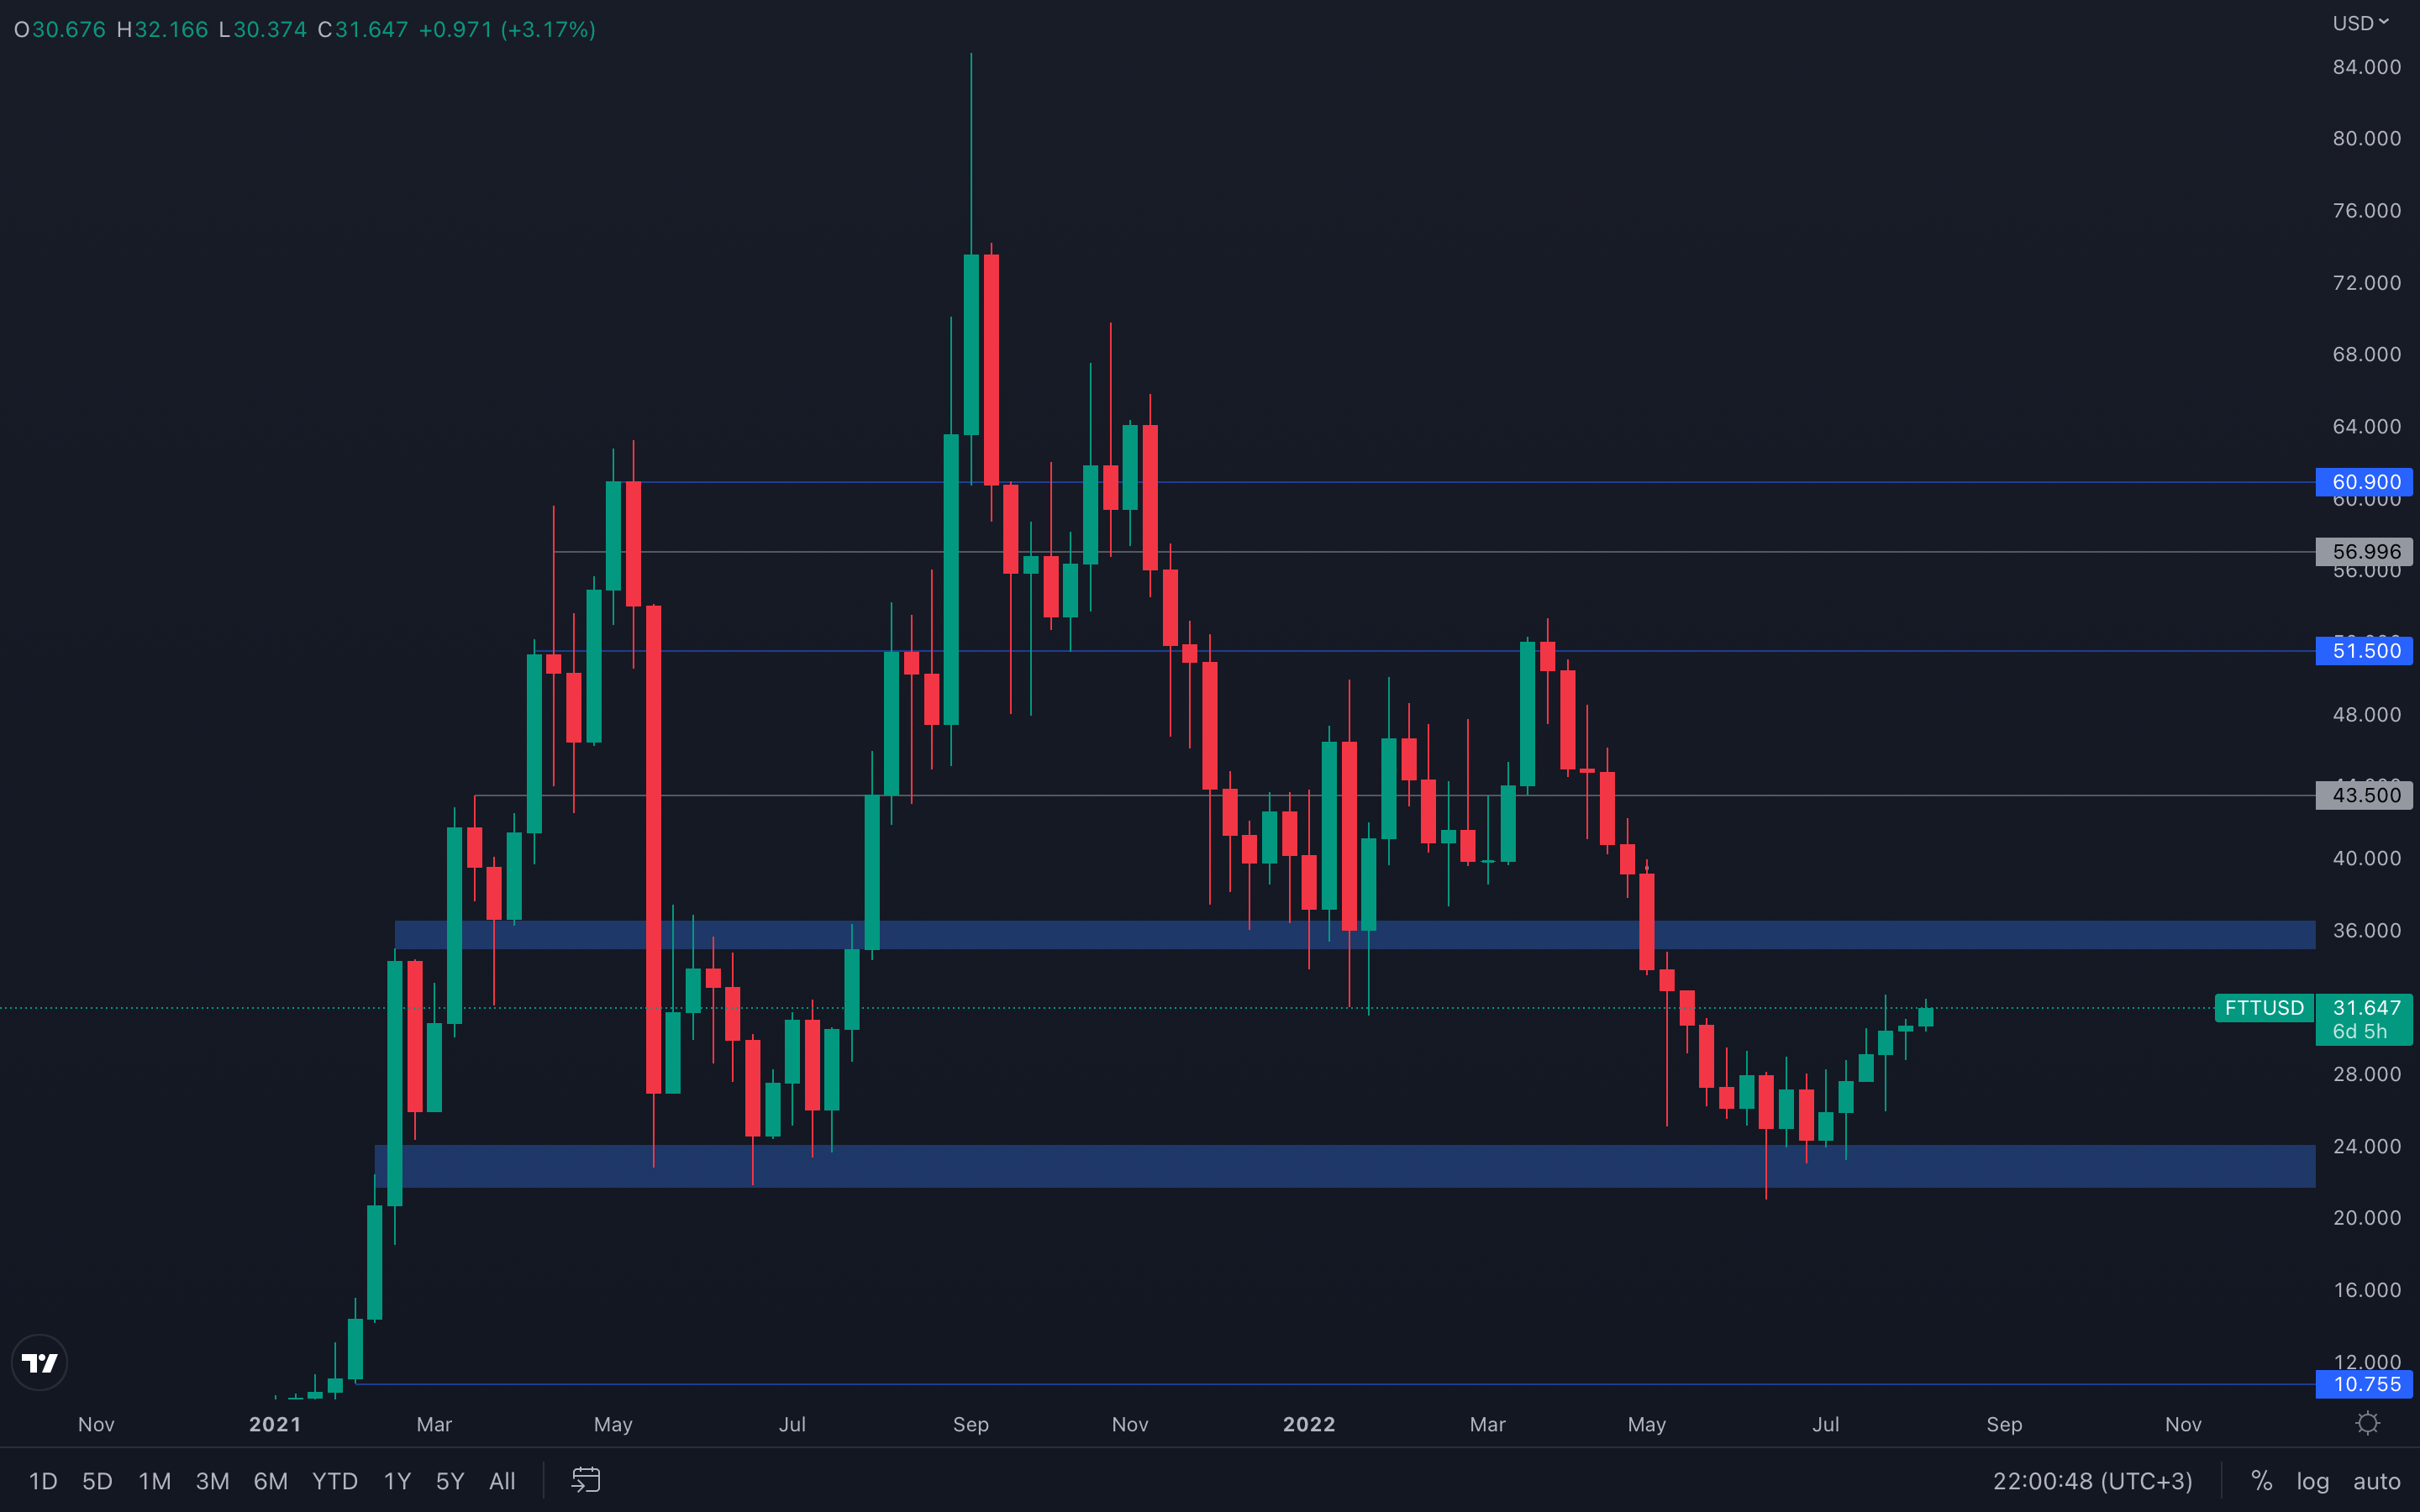 Clear price action - FTT has broken above its $30 local resistance level we were talking about in the previous report, which also acts as the middle of the $35 - $21.5 range. As there is still obvious strength in each candle, something we can deduce from the candle sizes and form, FTT is now on a path towards $35.
MINA
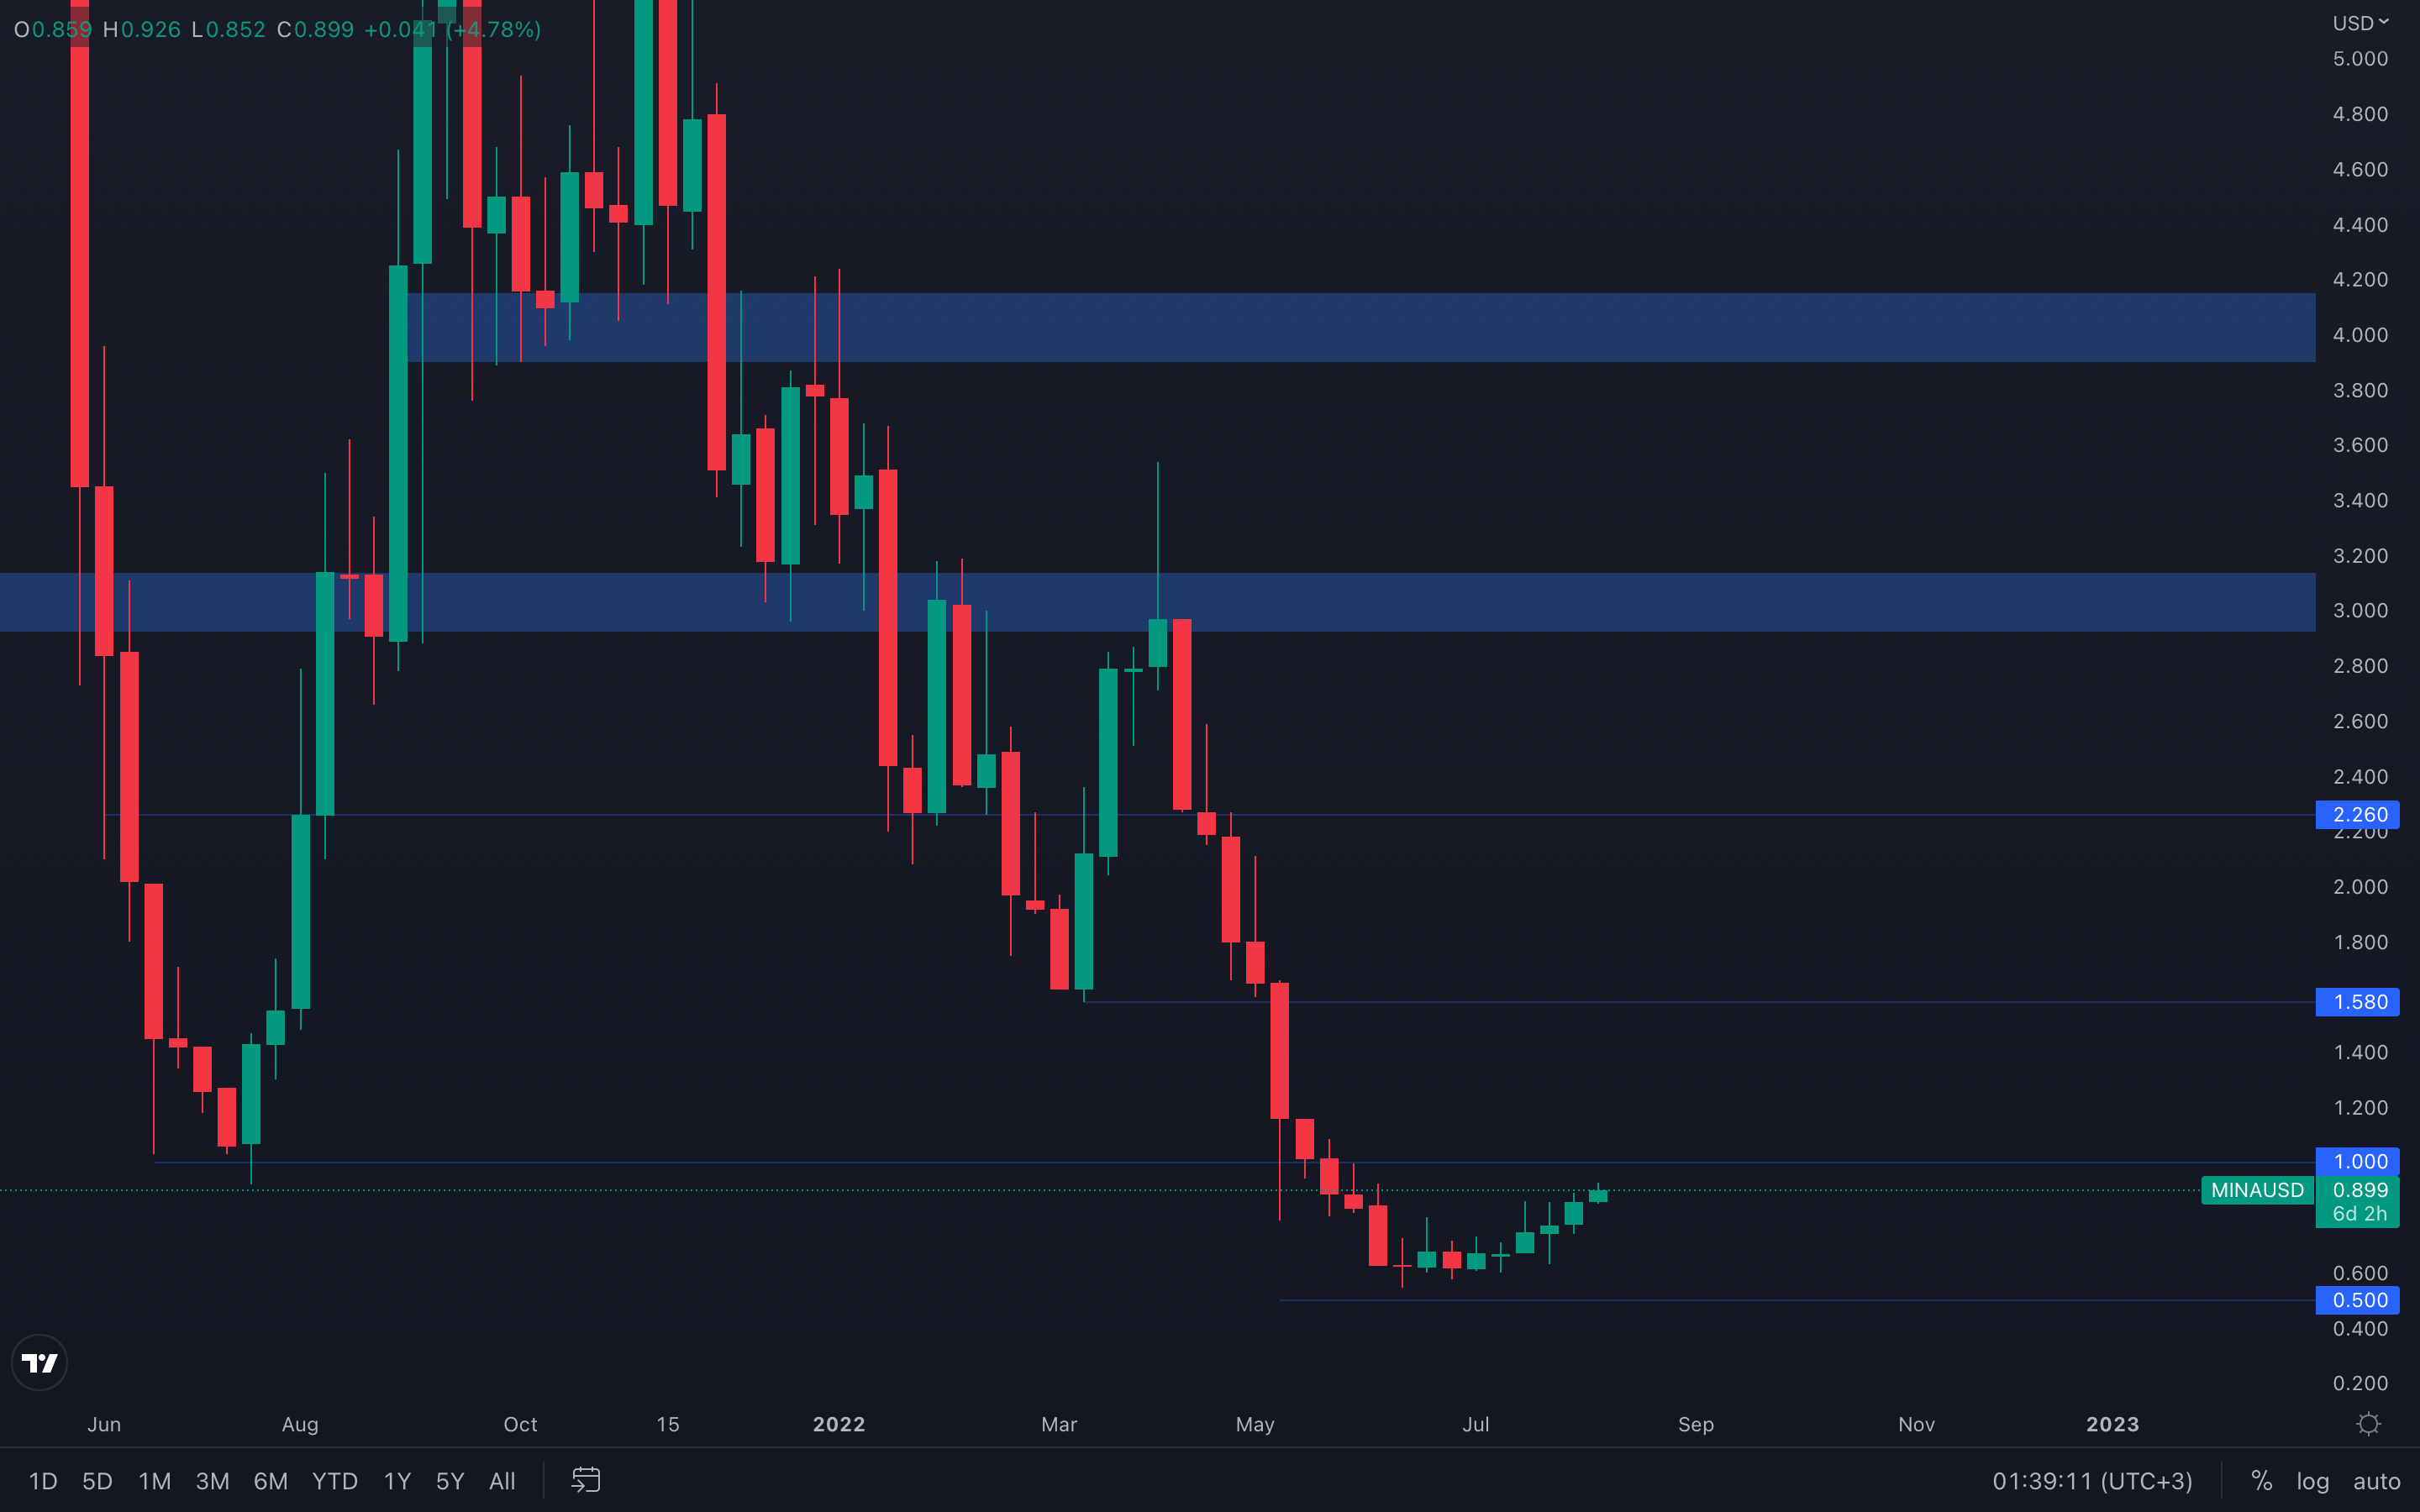 We're finally witnessing MINA showing actual strength in what looks to be a $1 test in the near future 😈. However, we're not so confident in MINA going for higher prices due to the current state of the market - the majors are still going to experience major resistance levels soon enough, and MINA still remains influenced by the majors' price action.
If a weekly $1 reclaim somehow still occurs, we should take into consideration ~$1.5 as the next target for MINA.
dYdX
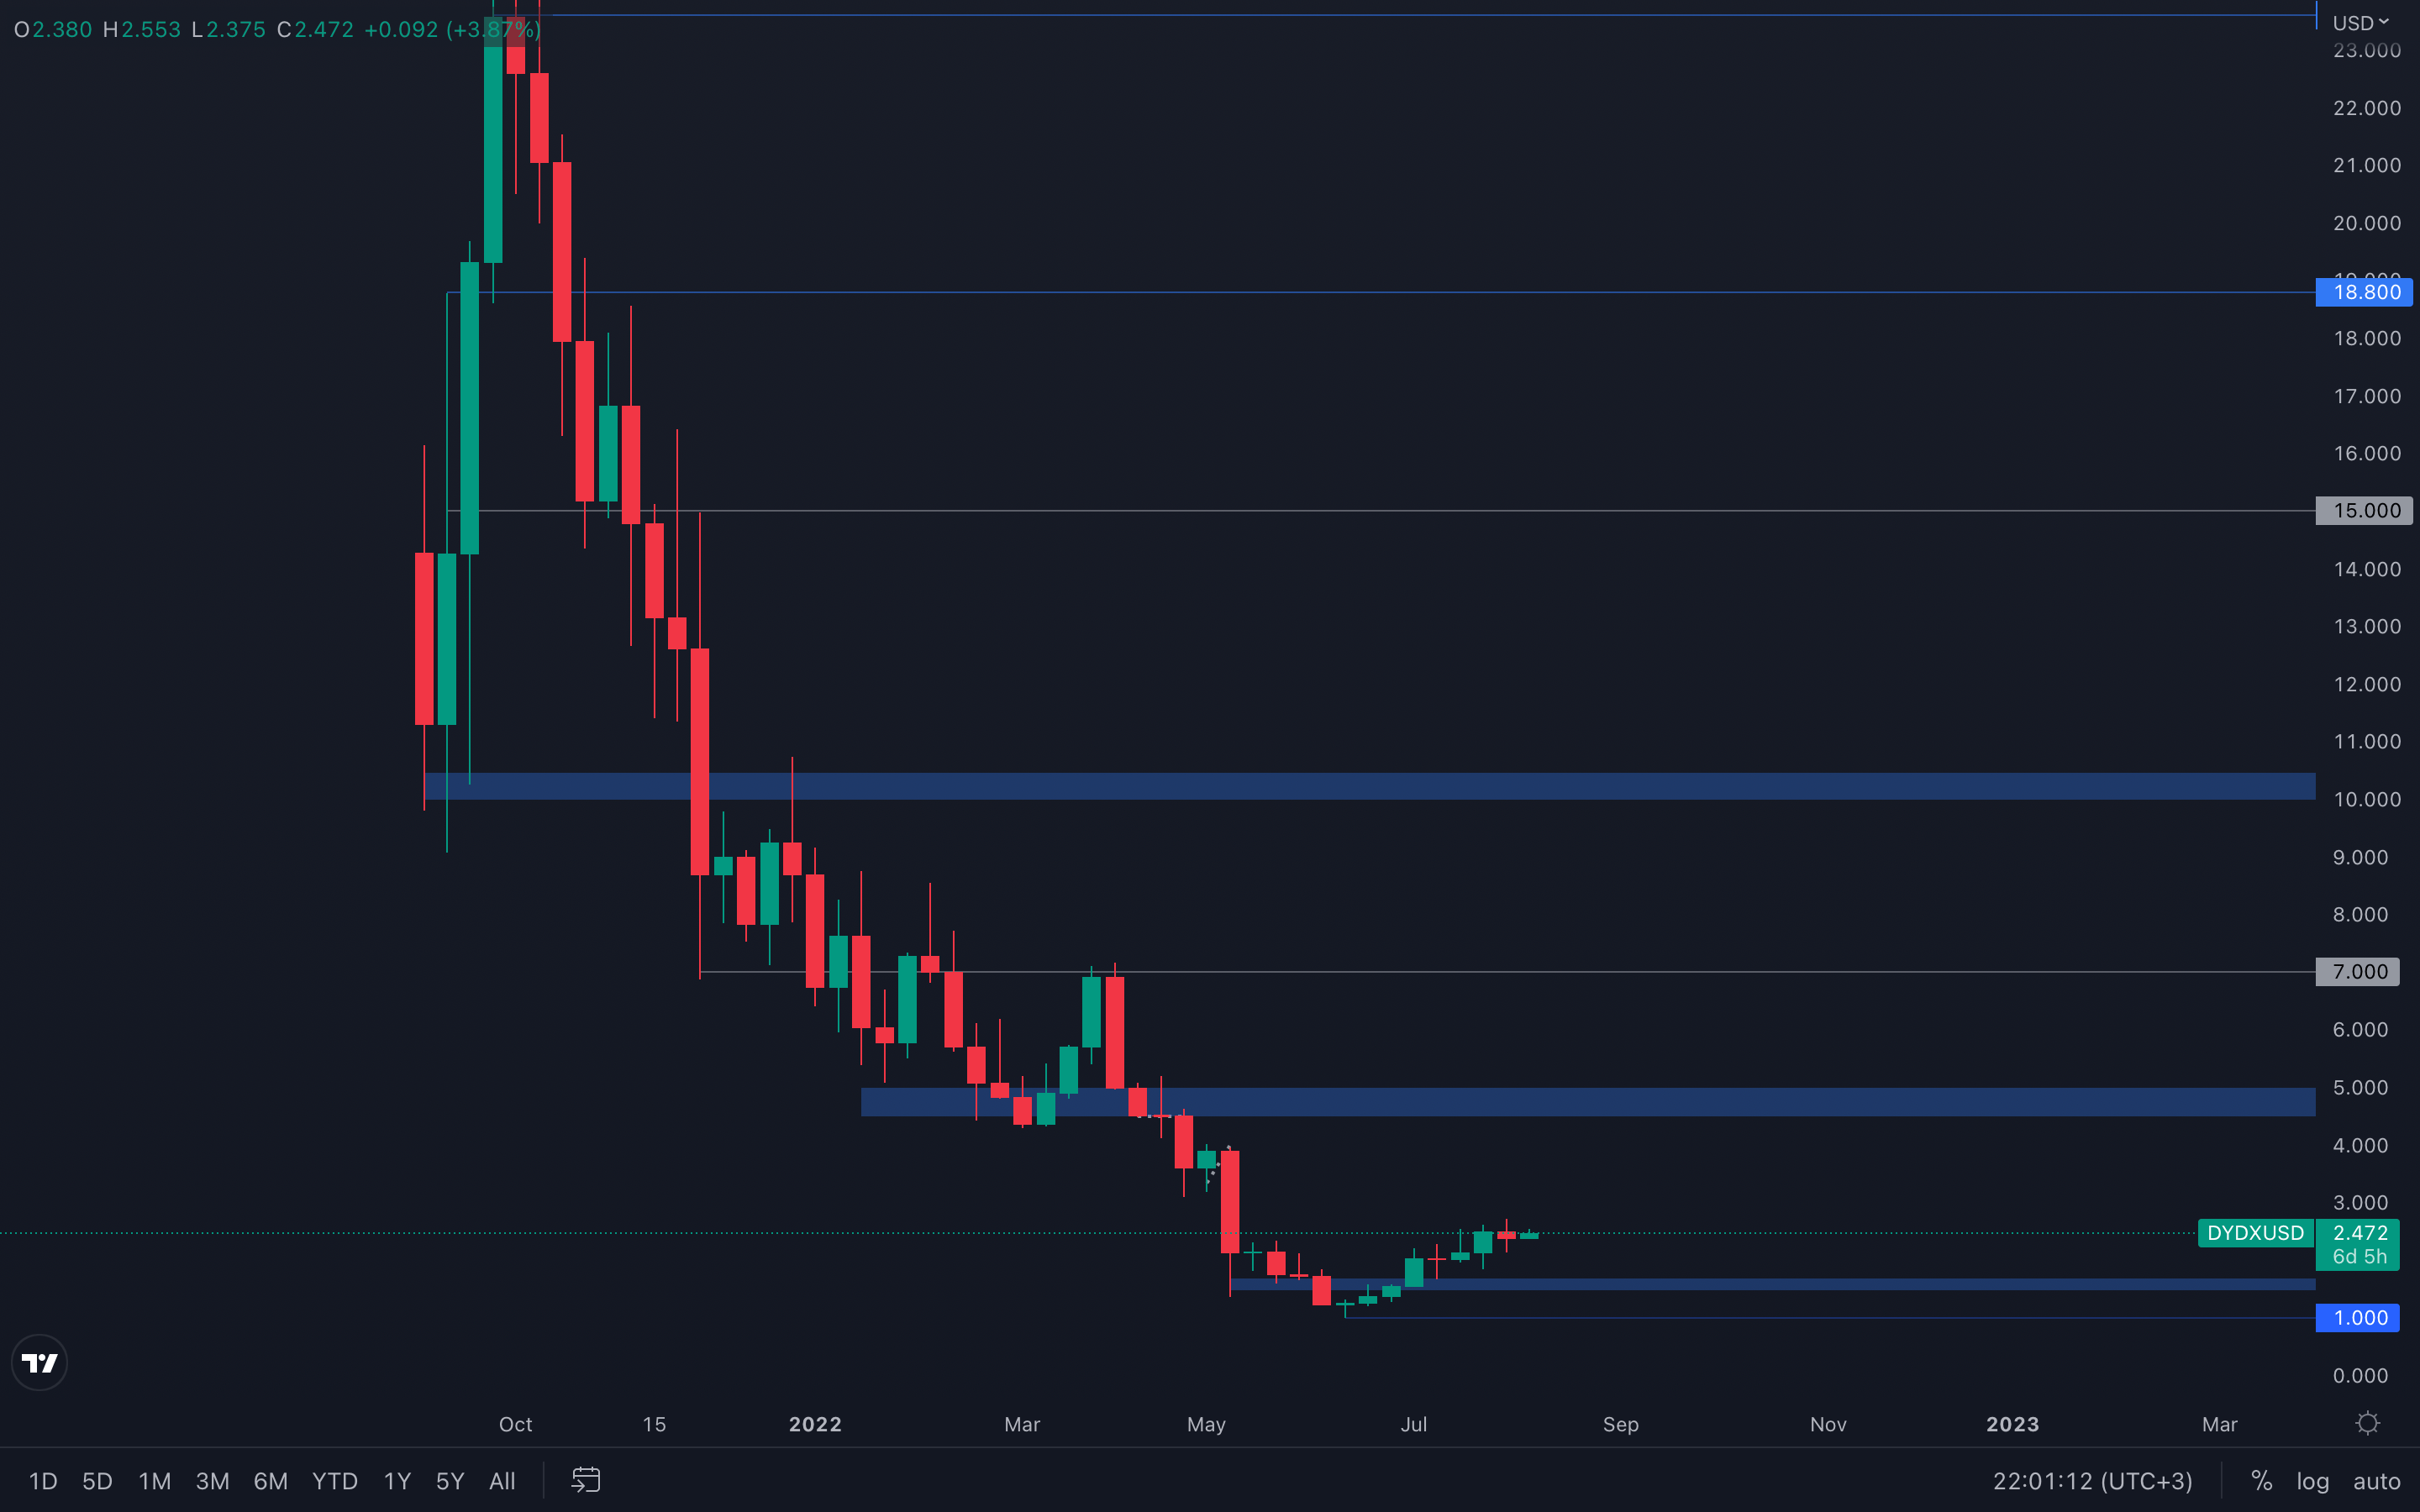 Bearish candle closure last week, which might not imply much confidence and is actually in a contradictorial state with most of the assets in this report. A weekly closure above $2.50 will invalidate last week's bearish candle and dYdX could continue towards $3, $3.5, $4, and other fixed price levels that can be interpreted as psychological levels.
dYdX is currently in a bullish market structure on the daily timeframe, and at least for now, should follow the majors and continue towards the upside, even if last week closed bearish. We will continue to update you on a daily basis if any changes occur.
Summary
The last few weeks suggest that we’re perhaps seeing a relief rally as older cohorts of coins have sold into it whilst there is still uncertainties ahead on the macro front. We also continue to see sentiment on the negative side as investors sell coins into break-even levels whilst lacking the conviction to hold in anticipation of higher prices.With the majors close to reaching significant resistance levels ($26,000 for BTC, and $2000 for ETH), it's safe to assume the market will encounter difficulty in rising further and can actually start to descend or range from here. Taking profits, especially in such rallies is key and an important component of actual survival in a bear market. Every given opportunity should be taken advantage of, even if it might be bigger than expected.
Recommended from Cryptonary